Table of Contents
- What Is Numerical Aperture and Why It Governs Resolution
- Abbe and Rayleigh: How Optical Resolution Is Defined
- Magnification vs Resolution: Clearing Up Common Misconceptions
- Wavelength, Immersion Media, and NA: Practical Trade-offs
- Lateral vs Axial Resolution and Depth of Field
- Condenser NA, Illumination Coherence, and Contrast Transfer
- Digital Sampling, Camera Pixels, and the Nyquist Criterion
- Reading Objective Labels: NA, Working Distance, and Corrections
- Choosing the Right Numerical Aperture for Your Specimen and Technique
- Frequently Asked Questions
- Final Thoughts on Choosing the Right Numerical Aperture
What Is Numerical Aperture and Why It Governs Resolution
In light microscopy, numerical aperture (NA) is the single most important specification linking optics to the detail you can see. While magnification tells you how large an image appears, NA tells you how much information the objective lens can actually capture from the specimen. If you want sharper, more finely resolved images, you need to understand NA.
Numerical aperture is defined as NA = n · sin(θ), where n is the refractive index of the medium between the specimen and the objective front lens (usually air, water, glycerol, or immersion oil) and θ is the half-angle of the widest cone of light the objective can accept from the specimen point. Higher NA means the objective collects light over a larger range of angles and thus captures higher spatial frequencies (finer detail). Because sin(θ) cannot exceed 1, NA in air (n ≈ 1) is limited to values up to roughly 1. With immersion media of higher refractive index (e.g., standard immersion oil around n ≈ 1.515; water around n ≈ 1.33; glycerol around n ≈ 1.47), objective NAs can exceed 1, enabling resolution beyond what is possible in air.
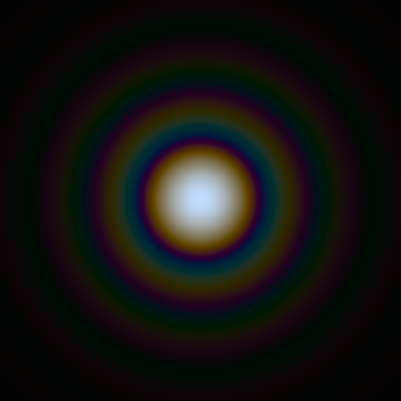
Why does NA govern resolution? Optical images of small objects are formed by diffraction. A point in the specimen is not imaged as a perfect point, but as an Airy pattern: a bright central disk surrounded by rings. The size of that central disk and the contrast between neighboring disks limit how close two points can be and still be distinguished. NA controls the angular spread and hence the width of that diffraction pattern; larger NA narrows the central disk, improves contrast at high spatial frequencies, and reduces the smallest resolvable feature size for a given wavelength.
NA also affects light collection efficiency and image brightness. For fluorescence and other light-limited modalities, the detected signal increases strongly with NA. But higher NA objectives typically have shorter depth of field, reduced working distance, and tighter tolerances on specimen mounting and cover glass thickness. Managing these trade-offs is a core skill in microscopy.
In this article, we connect the physics to practical decisions: How to interpret objective labels, how NA interacts with wavelength and immersion media, how to balance NA with magnification and digital sampling, how condenser NA and illumination impact contrast, and how to choose the right NA for your specimens and techniques.
Abbe and Rayleigh: How Optical Resolution Is Defined
Resolution in light microscopy is governed by diffraction, and classical criteria quantify what nullwiresnull of detail can be distinguished. Two widely used definitions are the Abbe limit and the Rayleigh criterion. They are not laws of nature, but practical rules that connect wavelength and NA to the smallest resolvable structure under typical imaging conditions.
- Abbe limit (periodic structures): For incoherent imaging of periodic features (like line gratings), the smallest resolvable line spacing d is approximately
d ≈ λ / (2 NA), where λ is the relevant wavelength of light. This expression emerges from Fourier optics, where the objective transmits spatial frequencies up to a cutoff proportional to NA/λ. - Rayleigh criterion (point sources): For two point-like emitters, the Rayleigh criterion defines the separation at which the first minimum of one pointnulls Airy pattern coincides with the central maximum of the other. The corresponding lateral resolution is
d ≈ 0.61 · λ / NA. This is frequently used in brightfield and fluorescence microscopy as a convenient estimate of lateral resolution.
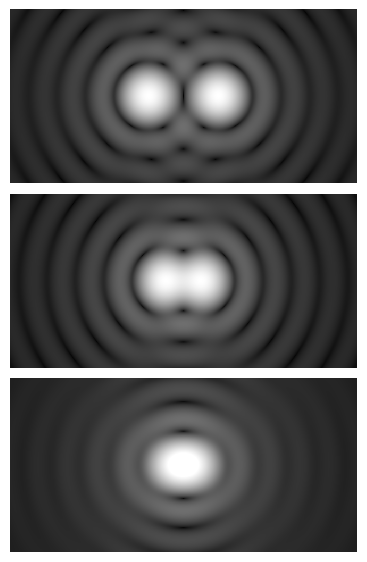
Two airy disks at various spacings: (top) twice the distance to the first minimum, (middle) exactly the distance to the first minimum (the Rayleigh criterion), and (bottom) half the distance.
This image uses a nonlinear color scale (specifically, the fourth root) in order to better show the minima and maxima. — Artist: Spencer Bliven
In practice, the distinction between these criteria seldom matters for everyday decision-making because they predict similar values and both emphasize the same dependencies: resolution improves (d gets smaller) with higher NA and with shorter wavelengths. When specifying resolution for fluorescence, the emission wavelength is typically used because that light forms the image.
Lateral vs axial resolution. The above relationships (Abbe/Rayleigh) focus on lateral resolution in the specimen plane. Axial (z) resolution, which measures the ability to distinguish points above and below each other along the optical axis, is coarser. For widefield microscopy under typical conditions, a commonly cited approximation for the axial resolution is Δz ≈ 2 n · λ / NA^2, where n is the immersion mediumnulls refractive index. Axial resolution depends more steeply on NA than lateral resolution does; doubling NA improves lateral resolution roughly 2× but can improve axial resolution by roughly 4× (in the approximation), highlighting the strong 1/NA2 dependence in the axial dimension.
Point spread function (PSF) and transfer functions. The PSF is the microscopenulls impulse response; it determines not just the smallest separable features but also the contrast at different spatial frequencies (the modulation transfer function, MTF). A system may technically resolve a pattern at the limit but render it with low contrast. Improving NA increases the cutoff frequency and boosts high-frequency contrast, enhancing both resolution and image crispness.
These definitions set the stage for the core message of this article: upgrading NA, not merely increasing magnification, is what truly advances resolution. We expand on that idea in Magnification vs Resolution and connect it to practical choices in Choosing the Right Numerical Aperture.
Magnification vs Resolution: Clearing Up Common Misconceptions
It is easy to conflate magnification with resolution, but they answer different questions. Magnification tells you how large the image appears; resolution tells you how much independent detail the optical system can distinguish. You can magnify a blurry image indefinitely; it will not gain real detail. This section clarifies their roles and interplay.
- Optical resolution is governed by NA and wavelength, not by magnification. For a given objective, switching to a higher magnification eyepiece or increasing camera display scale does not improve the resolvable feature size. The finest detail is set primarily by Abbe/Rayleigh relations, where NA and λ are the variables that matter.
- Useful magnification range. There is a range in which magnification is nullusefulnullnulli.e., where it enlarges real resolved details to match the detector or the observernulls eye acuity. Below this range, details smaller than a pixel are undersampled; above this range, you enter nullempty magnificationnull: the image looks bigger but contains no additional information.
- Matching magnification to sampling. With digital cameras, nulluseful magnificationnull is tied to pixel size and the microscopenulls resolution. For optimal sampling, the specimen-plane pixel size should meet the Nyquist criterion relative to the optical resolution. We elaborate on this in Digital Sampling, Camera Pixels, and the Nyquist Criterion.
- Why higher magnification objectives often have higher NA. Many high-magnification objectives (e.g., 60×, 100×) are designed with high NA and immersion media to deliver both enlargement and true resolution. But magnification alone does not guarantee higher NA; always check the NA printed on the objective.
Key takeaway: If your goal is sharper, more detailed images, prioritize higher NA and appropriate wavelength over simply increasing magnification. Ensure that magnification and camera sampling then match the achievable resolution to avoid undersampling or empty magnification.
Wavelength, Immersion Media, and NA: Practical Trade-offs
Resolution depends on NA and wavelength. Within the visible spectrum, shorter wavelengths (blue/green) support finer resolution than longer wavelengths (red). Immersion media determine the refractive index n in the NA expression and define achievable NA and aberration control for a given specimen geometry.
How wavelength enters resolution formulas
Immersion media and refractive index matching
Standard objective classes include air (n ≈ 1.00), water immersion (n ≈ 1.33), glycerol immersion (n ≈ 1.47), and oil immersion (n ≈ 1.515). Higher n permits larger NA because NA = n · sin(θ). Immersion objectives also mitigate refractive index mismatches between specimen, mounting medium, and cover glass, which otherwise cause spherical aberration and loss of resolution and contrast, especially at higher NAs and deeper focus.
- Air objectives: Convenient and versatile. Typical maximum NA is below 1 (often 0.95 or less). Good choice for dry samples or when working distance is a priority.
- Water immersion objectives: Index closer to many biological samples and aqueous mounting media. Reduced spherical aberration when focusing deeper into water-based specimens. Useful for live-cell or thick aqueous samples. NA commonly up to around 1.2 in practical designs.
- Glycerol immersion objectives: Index between water and oil. Can be a compromise for specimens in media with intermediate refractive index. Useful for reducing mismatch across modest depth ranges.
- Oil immersion objectives: Highest typical NA in visible light microscopy. Well suited to thin, cover-slipped samples where the refractive path is designed for oil (e.g., standard cover glass thickness). Often chosen for maximum lateral resolution and fluorescence brightness.
Selection is not only about the absolute NA value; itnulls about matching refractive indices along the entire optical path (immersion medium, cover glass, mounting medium, specimen) to minimize aberrations. See Reading Objective Labels: NA, Working Distance, and Corrections for guidance on cover glass thickness and correction collars.
Trade-offs to consider
- Working distance vs NA: Higher NA often entails a shorter working distance due to the larger lens aperture required. For thick or irregular samples, a slightly lower NA objective with longer working distance may be more practical.
- Depth of field: As NA increases, depth of field shrinks. This can be advantageous for optical sectioning but may make focusing and full-object imaging harder without z-stacking. More in Lateral vs Axial Resolution and Depth of Field.
- Illumination intensity and photophysics: For fluorescence, higher NA objectives collect more light; however, shorter wavelengths used to improve resolution may increase photobleaching in some fluorophores. Keep the trade-off in mind for live or light-sensitive samples.
Lateral vs Axial Resolution and Depth of Field
Microscopic structures are three-dimensional, so understanding both lateral (xnully) and axial (z) resolution is essential. While lateral resolution is often quoted first, axial resolution and depth of field govern how crisp structures appear in 3D and how thin an optical section you can achieve with widefield imaging.
Lateral and axial resolution recap
- Lateral resolution (widefield, incoherent): A commonly used estimate is
Δx ≈ 0.61 · λ / NA. This scale corresponds to the radius of the Airy disknulls central maximum in the image of a point source. - Axial resolution (widefield, incoherent): A typical approximation is
Δz ≈ 2 n · λ / NA^2. The PSF extends more along the optical axis than in the lateral plane, explaining the thicker sections in widefield imaging.

These relationships describe the fundamental, diffraction-limited performance when aberrations are well corrected. Real systems may perform worse due to spherical aberration (e.g., cover glass mismatch), misalignment, or insufficient condenser NA (which reduces high-frequency contrast). Practical resolution is also influenced by the sampling of the camera and the signal-to-noise ratio.
Depth of field (DOF) vs depth of focus
- Depth of field (specimen space): The axial range in the specimen over which features appear acceptably sharp in the image. For diffraction-limited imaging, the DOF scales roughly like
∼ λ n / NA^2(diffraction contribution). Additional geometric blur terms can arise from detector sampling and display criteria, which effectively add to the tolerable defocus. - Depth of focus (image space): The allowable focus tolerance at the image plane (camera sensor) that still yields an acceptably sharp image. Depth of focus increases with magnification and is distinct from DOF in the specimen. Both are related via the imaging system magnification and pupil geometry.
High NA objectives provide thinner optical sections (smaller DOF), which helps isolate planes within a specimen. But that same thin DOF makes focusing more sensitive and can challenge imaging of samples that are not flat or that move during acquisition.
Optical sectioning without confocal hardware
Even in widefield imaging, you can leverage DOF and illumination to enhance sectioning:
- Use higher NA (within your samplenulls tolerance) to thin the axial PSF and DOF.
- Choose shorter wavelengths (consistent with photostability and sample needs) to marginally improve axial resolution.
- Ensure proper condenser aperture setting to maintain high-frequency contrast (see Condenser NA, Illumination Coherence, and Contrast Transfer).
These steps do not replace confocal or structured illumination techniques, but they help you reach the best possible performance for your widefield system.
Condenser NA, Illumination Coherence, and Contrast Transfer
The objectivenulls NA is only part of the story. In transmitted-light microscopy, the condenser shapes the illumination cone incident on the specimen. Its numerical aperture (NAcond) and the degree of spatial coherence influence image contrast, especially at higher spatial frequencies.
Matching condenser NA to objective NA
For brightfield imaging of amplitude objects under Köhler illumination conditions, a common guideline is to set the condenser aperture so that NAcond is on the order of the objective NA, often slightly lower. When the condenser aperture is too small relative to the objective NA, the system lacks the high-angle illumination needed to transfer the highest spatial frequencies with good contrast. On the other hand, opening the condenser aperture fully can reduce contrast for low-spatial-frequency features and make the image appear nullflatter, null though resolution remains limited by the objective NA.
- Too low NAcond: High-frequency contrast drops, fine details appear washed out even if the objective has high NA.
- Appropriately matched NAcond: Balanced contrast and resolution transfer across a wide range of spatial frequencies.
Put simply, if your high-NA objective is not delivering crisp fine detail in transmitted-light brightfield, ensure the condenser aperture is not inadvertently limiting effective illumination NA. This concept is related to the systemnulls contrast transfer function and the partial coherence of the illumination.
Phase and differential interference contrast (DIC)
Beyond brightfield, specialized contrast methods exploit phase and polarization effects. Although these techniques do not change the diffraction limit per se, they can make fine structures more visible by transforming phase differences into intensity differences or by enhancing edge contrast. The achievable detail still depends strongly on objective NA, and illumination settings are technique-specific:
- Phase contrast: Relies on annular illumination and phase plates in the objective. Objective NA and matching phase ring geometry govern contrast; optimal performance requires correctly matched condenser annulus and objective phase plate.
- DIC: Introduces shear and polarization optics to convert gradients in optical path length into intensity variations. High NA improves lateral resolution and gradient sensitivity; proper prism pairing and polarization alignment are essential.
Details of aligning these techniques are beyond the scope here; the main point is that objective NA remains the foundation for resolution, while contrast methods exploit different physical effects to manifest that resolution in intensity images.
Digital Sampling, Camera Pixels, and the Nyquist Criterion
Digital cameras discretize the image into pixels, each of which integrates light over its area. To faithfully represent the optical detail available at the specimen plane, your sampling must meet the Nyquist criterion: sample at least twice the highest spatial frequency you wish to reconstruct, or equivalently, use a specimen-plane pixel size no larger than half the optical resolution (ideally smaller to account for practical factors).
Relating camera pixel size to specimen-plane sampling
The specimen-plane pixel size is the cameranulls physical pixel size divided by the total magnification from the specimen to the camera sensor. For example, if your camera pixels are 6.5 μm wide and your total magnification onto the camera is 40×, the specimen-plane pixel size is 6.5 μm / 40 ≈ 0.1625 μm. If your optical lateral resolution is around 0.3 μm, Nyquist sampling suggests a specimen-plane pixel size of about 0.15 μm or finer; in this case, 40× is appropriate. If your optical resolution is coarser (e.g., 0.6 μm), you can use a lower total magnification while still achieving proper sampling.
Many objectives list magnification (e.g., 20×, 40×) but the total magnification to the camera can include additional intermediate optics (e.g., a 1.0× or 0.63× tube lens or camera relay). Calculating sampling at the specimen requires accounting for the complete imaging path to the sensor.
Practical sampling guidelines
- Target Nyquist or modestly oversample: A specimen-plane pixel size at roughly half the expected lateral resolution is a baseline. Slightly finer sampling (e.g., 2.3–3 pixels across the diffraction-limited spot size) can improve deconvolution and downstream analysis at the cost of larger data volumes.
- Avoid gross undersampling: If your pixel size at the specimen is much larger than half the resolution limit, high-frequency detail will be aliased and lost. The image may look nullsharpnull at low magnification on screen but cannot recover true fine structure.
- Watch the signal-to-noise ratio: Finer sampling spreads photons across more pixels, potentially reducing per-pixel signal-to-noise if exposure or illumination is not adjusted. Balancing sampling and photon efficiency is key, especially in low-light fluorescence.
Sampling cannot create resolution that the optics do not deliver; it simply makes the available detail visible and machine-readable. Conversely, excellent optics can be limited by poor sampling choices. For a step-by-step example linking NA to sampling decisions, revisit Magnification vs Resolution and the Nyquist discussion here.
Reading Objective Labels: NA, Working Distance, and Corrections
Objective lens barrels contain a wealth of information that indicates how the lens will perform and under what conditions. Understanding these markings helps you choose and use objectives to achieve the intended resolution and contrast.
Common objective markings explained
www.micro-shop.zeiss.com/ — Artist: ZEISS Microscopy
An objective might be labeled: 40× / 0.65 ∞ / 0.17. Here is what those parts mean:
- Magnification (40×): The objectivenulls nominal linear magnification at the specified tube lens focal length.
- Numerical aperture (0.65): The objectivenulls NA; this is the critical number for resolution and light-gathering power.
- Tube length (∞ or 160): Many modern systems are infinity-corrected (∞), which use a specific tube lens to form the final image. Finite systems (e.g., 160 mm) are designed for a fixed mechanical tube length.
- Cover glass thickness (0.17): Indicates the objective is corrected for a standard coverslip of approximately 0.17 mm (commonly designated as #1.5). Some objectives specify a range (e.g., 0.13–0.21). Objectives marked null0null are intended for uncovered specimens or reflective applications.
Additional markings may indicate immersion medium (e.g., Oil, Water, Glycerol), specialized contrast (Phase, DIC), or correction level (e.g., achromat, fluorite, apochromat), which relate to chromatic and spherical aberration correction and field flatness. Higher correction levels generally provide better color correction and flatter fields, often important for imaging across wide spectral ranges or large sensors.
Working distance and NA
Working distance is the distance from the objectivenulls front lens to the specimen when in focus. For a given magnification, higher NA often reduces the working distance because the lens must accept higher-angle rays, implying a larger front lens and closer proximity to the sample. High-NA oil objectives may have working distances well below a millimeter. Long working distance objectives sacrifice NA to gain clearance, useful for thicker samples or when integrating micro-manipulators.
Cover glass thickness and correction collars
Objectives corrected for a cover glass thickness typically assume a value around 0.17 mm (#1.5). Deviations from this thickness, or refractive index mismatch in the immersion/mounting media, introduce spherical aberration, which degrades resolution and contrast, especially at high NA. Some high-NA dry or water objectives include a correction collar that allows minor tuning of the optics to compensate for variation in cover glass thickness or immersion conditions. If your images lose contrast as you focus deeper into a mounted sample, or if the best focus looks nullsoft, null check both the cover glass specification and whether the collar needs adjustment.
Infinity correction and tube lenses
In infinity-corrected systems, the objective produces a collimated beam, and an internal tube lens forms the image at the camera or eyepiece. The tube lens focal length sets the objectivenulls effective magnification; using a non-standard tube lens changes magnification and can stress the objectivenulls correction design. When calculating specimen-plane sampling, include any magnification changes introduced by the tube lens and camera relay optics.
Choosing the Right Numerical Aperture for Your Specimen and Technique
With the theory established, how do you choose NA in practice? The right NA balances resolution needs, sample geometry, working distance, contrast, illumination, and data handling. Below are common scenarios and considerations.
Thin, high-contrast specimens (e.g., fixed stained tissue, printed microfeatures)
- Goal: Maximize lateral resolution and contrast for planar samples under a coverslip.
- Recommended approach: Use a high-NA oil objective corrected for #1.5 cover glass if the sample is mounted accordingly. Align condenser aperture to maintain high-frequency contrast in brightfield, or use appropriate filter sets in fluorescence. Set sampling to meet Nyquist for the chosen NA and wavelength.
- Trade-offs: Short working distance and tight tolerances on cover glass and mounting. Higher illumination doses may be needed for small pixels at fine sampling.
Thicker aqueous samples (e.g., live cell cultures in media)
- Goal: Resolve subcellular features with minimal spherical aberration while maintaining viability and focus stability.
- Recommended approach: Water immersion objectives with moderate to high NA can outperform dry objectives of similar magnification when imaging into aqueous media. They reduce refractive index mismatch and preserve contrast at depth. Keep DOF in mind and consider z-stacking as needed.
- Trade-offs: Slightly lower maximum NA than oil; immersion handling is required. Sampling and exposure must be balanced to manage phototoxicity in fluorescence.
Large, opaque, or uneven specimens (e.g., small parts inspection, rough surfaces)
- Goal: Adequate detail over variable topography; reasonable working distance; good field of view.
- Recommended approach: Moderate NA air objectives provide a practical balance. Consider objectives designed for longer working distances. If the specimen is reflective, illumination geometry and polarization can enhance contrast without pushing to extreme NAs.
- Trade-offs: Lower ultimate resolution than high-NA immersion but greater tolerance for irregular samples and easier handling.
Fluorescence imaging (general)
- Goal: Maximize photon collection efficiency and resolution for dim signals.
- Recommended approach: High-NA objectives (oil or water, depending on specimen) improve both resolution and light collection. Optimize emission filters for the target fluorophore(s). Match pixel sampling to the resolution dictated by emission wavelengths.
- Trade-offs: Manage photobleaching and phototoxicity with careful exposure and illumination control. Shorter wavelengths improve resolution but can be more damaging; weigh the benefit against sample needs.
Polarization, phase, and DIC imaging
- Goal: Enhance contrast of transparent or birefringent specimens.
- Recommended approach: Choose objectives compatible with the contrast method (e.g., phase objectives matched to condenser annuli; DIC-compatible objectives and prisms). Higher NA improves the visibility of fine gradients and edges.
- Trade-offs: Setup requires appropriate condenser and intermediate optics. The diffraction limit remains set by NA and wavelength; contrast methods primarily translate optical path differences into intensity.
Quantitative imaging and measurement
- Goal: Reliable, calibrated measurements of feature sizes and intensities.
- Recommended approach: Use well-corrected objectives with known NA and field flatness across the camera sensor. Ensure Nyquist-compliant sampling and stable illumination. Calibrate pixel size at the specimen plane and verify focus repeatability.
- Trade-offs: Higher NA improves resolution but constrains DOF; careful focusing and possibly z-stacks are needed for accurate 3D measurements.
Balancing NA with data management and workflow
- Higher NA often entails finer sampling and larger images. Plan for storage and processing requirements, especially for tiled or 3D datasets.
- If inspection or screening speed is more important than ultimate resolution, a lower NA and coarser sampling may be more efficient, provided it meets your detection thresholds.
Frequently Asked Questions
How does numerical aperture affect image brightness?
Two related effects make high-NA objectives deliver brighter images in light-limited modalities like fluorescence. First, higher NA collects light over a wider cone (larger solid angle), capturing more emitted photons from each point in the specimen. Second, a higher NA objective concentrates excitation (for epi-illumination fluorescence) into a smaller focal volume, which can increase fluorophore excitation density in the focal plane for a given illumination setting. The exact brightness gain depends on the optical configuration and illumination method, but qualitatively, increasing NA increases both collection efficiency and, for epi modes, the fraction of excitation directed into the specimen. Note that increased brightness does not imply increased resolution beyond the diffraction limit; rather, it supports higher signal-to-noise at that limit.
Is there any benefit to using a very short-wavelength filter to push resolution?
Shorter wavelengths do improve theoretical resolution by reducing λ in the Abbe/Rayleigh expressions. However, several practical constraints apply. Many objective lenses are optimized for certain spectral bands; moving to the extreme blue or ultraviolet may introduce chromatic aberrations or reduced transmission unless the optics are designed for those wavelengths. Shorter wavelengths can increase photobleaching in fluorescence and may reduce sample viability or alter materials under examination. Finally, cameras and detectors often have lower quantum efficiency at very short wavelengths. In practice, choosing a wavelength that balances resolution, detector sensitivity, optical transmission, and sample preservation usually yields better results than pushing to the shortest possible wavelength.
Final Thoughts on Choosing the Right Numerical Aperture
Numerical aperture is the lens specification that most directly governs the detail you can resolve in optical microscopy. The classic diffraction relationships make the dependencies clear: higher NA and shorter wavelengths reduce the smallest resolvable feature size. But extracting the full benefit requires a systems view. Condenser NA and illumination coherence shape high-frequency contrast transfer. Cover glass thickness, refractive index matching, and correction collars control spherical aberration that can otherwise erode performance, especially at high NA. Digital sampling must meet the Nyquist criterion to faithfully capture the optical resolution without aliasing. Working distance, depth of field, and data volume are the inevitable trade-offs to weigh against resolution goals.
When planning your imaging, start with the question: What features must I reliably distinguish? Use that requirement to choose an appropriate NA and wavelength band. Then align the rest of the system around that choice: configure condenser aperture, ensure correct cover glass and immersion medium, set camera sampling to at least Nyquist, and balance exposures for adequate signal-to-noise. If your specimen or workflow cannot accommodate the constraints of very high NA (short working distance, thin DOF, tight tolerances), step down slightly in NA and regain practicality while still meeting the resolution your task truly demands.
For more foundational explorations like this onenulland for advanced topics such as contrast mechanisms, aberration sources, and quantitative imaging best practicesnullconsider subscribing to our newsletter. Younullll get in-depth articles that build on the principles discussed here, with clear explanations geared for students, educators, and serious hobbyists who want to get the most from their microscopes.