Table of Contents
- What Is Numerical Aperture in Microscopy?
- How Resolution Is Set: Abbe and Rayleigh Criteria
- Magnification Versus Resolution: Avoiding Empty Magnification
- Wavelength, Immersion Media, and Refractive Index Effects
- Depth of Field, Working Distance, and Field of View Trade-offs
- Illumination and Contrast: Köhler, Coherence, and Condenser NA
- Sampling on Sensors: Pixel Size, Nyquist, and Effective Magnification
- Choosing Objectives by NA, Magnification, and Cover Glass
- Brightfield, Phase Contrast, DIC, and Darkfield: Resolution Implications
- Calibration and Measuring Features Accurately
- Common Misconceptions and Practical Benchmarks
- Frequently Asked Questions
- Final Thoughts on Choosing the Right NA and Magnification Strategy
What Is Numerical Aperture in Microscopy?
Numerical aperture (NA) is a central quantity in optical microscopy because it simultaneously governs light-gathering ability, resolving power, and the brightness of the image. If you remember only one number on an objective besides its magnification, make it the NA.
By definition, the numerical aperture of an objective lens is
NA = n · sin(θ)
where n is the refractive index of the medium between the specimen and the objective’s front lens (for example, approximately 1.00 for air, ~1.33 for water, and ~1.515 for standard immersion oil), and θ is half the angular extent of the cone of light that the objective can accept from the specimen. A higher NA means the objective accepts a wider cone of diffracted light, which contains higher spatial frequencies from the specimen and thus more fine detail.
Several important consequences flow from this simple definition:
- Resolution increases with NA. The smallest resolvable feature size decreases as NA increases. See How Resolution Is Set for the specific criteria.
- Image brightness increases with NA. For a given illumination and magnification, higher-NA objectives collect more light. In widefield fluorescence, for example, signal scales steeply with NA because emission collection depends on the solid angle of light captured.
- Depth of field shrinks as NA increases. Higher-NA optics focus more tightly, so less axial range appears simultaneously in focus. We detail this in Depth of Field, Working Distance, and Field of View.
- Working distance typically decreases with NA. Objectives that achieve higher NA often have larger front elements that must be positioned closer to the specimen (see trade-offs).
Because NA depends on both geometry and medium, the same objective design can support different NA values depending on whether you are using air, water, or oil between the specimen and the front lens. This is why immersion objectives advertise both a nominal NA and the immersion medium; e.g., a 60×/1.40 oil objective is designed to reach NA ≈ 1.40 when used with the specified immersion oil and cover glass thickness. For air objectives, NA usually tops out around 0.95; for oil, it can exceed 1.4. We explore how immersion media alter resolution and brightness in Wavelength, Immersion Media, and Refractive Index Effects.
Practical takeaway: If your goal is to see finer detail, prioritize NA first, then choose magnification to fit the field of view and sampling requirements (Sampling on Sensors). Magnification alone does not create new detail—NA does.
How Resolution Is Set: Abbe and Rayleigh Criteria
In brightfield and fluorescence microscopy, the smallest lateral spacing you can resolve is fundamentally limited by diffraction. While real-world performance also depends on aberrations, noise, focus stability, and specimen contrast, the diffraction limit provides a reliable baseline for what is physically achievable with a given optical configuration.
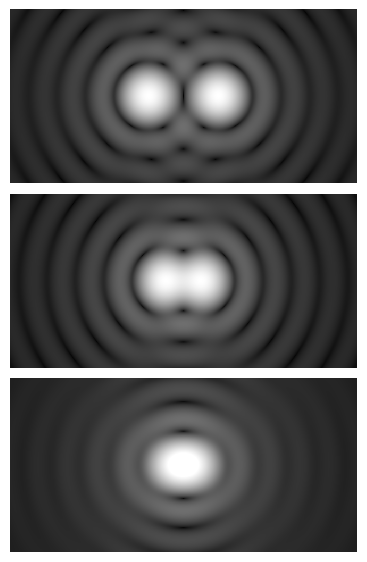
Two closely related expressions are widely used to estimate lateral resolution for incoherent or partially coherent imaging:
- Abbe limit for periodic structures:
d_Abbe ≈ λ / (2 · NA) - Rayleigh criterion for two point sources:
d_Rayleigh ≈ 0.61 · λ / NA
Here, λ is the wavelength of light contributing to image formation (illumination wavelength for reflective/transmitted brightfield or emission wavelength for fluorescence), and NA is the numerical aperture of the objective. Note that λ / (2 · NA) and 0.61 · λ / NA give similar—though not identical—estimates. Both capture the same scaling: resolution improves as wavelength decreases and as NA increases.
For axial (z) resolution or sectioning in widefield systems, a commonly used approximate scaling is
Δz ∝ λ · n / NA²
where n is the refractive index of the imaging medium. The exact constant of proportionality depends on the imaging modality and definition used, but the key trend is that axial resolution improves roughly with the square of NA and degrades with longer wavelengths. This is why high-NA oil objectives dramatically narrow the focal slab compared to low-NA air objectives.
Rule of thumb: going from NA 0.65 to NA 1.30 roughly halves the lateral diffraction-limited feature size and improves axial resolution by approximately a factor of four, all else equal.
These criteria assume diffraction-limited optics and proper illumination. If the condenser NA is stopped down too far in brightfield, lateral resolution will degrade regardless of objective NA (see Illumination and Contrast). Likewise, specimen-induced aberrations—such as imaging through an incorrect cover glass thickness—can blur fine detail even if the nominal NA is high (Objective Selection).
It is also crucial to distinguish resolution from detectability. You may detect the presence of a very small object (e.g., a sub-resolution fluorescent bead) as a blurred spot, but you cannot resolve two such objects closer together than the diffraction-based separation predicted above.
Magnification Versus Resolution: Avoiding Empty Magnification
Magnification scales the image size, but it does not create new detail. If the optical system cannot resolve features smaller than a certain size, further magnification simply spreads the same blur over more pixels or a larger retinal area. This diminishing return is known as empty magnification.
To understand the useful magnification range for a given NA and wavelength, first estimate the lateral resolution limit d using Abbe or Rayleigh. Useful total magnification is then the range that enlarges this smallest resolvable feature to a size that the detector or eye can comfortably sample and perceive.
- For visual observation (eyepieces): A widely cited practical guideline is that useful total magnification lies roughly between 500× and 1000× the NA of the objective. For example, with an NA 0.95 air objective, useful total magnification is typically in the range of ~475× to ~950×. Below this range, you may not perceive the finest details; above it, the view becomes large but not more informative.
- For cameras: The useful magnification depends on the sensor’s pixel size. The effective pixel size at the specimen plane is
a / M, whereais the sensor pixel size andMis the objective’s lateral magnification (or total optical magnification into the camera). Nyquist sampling suggests aiming for about two or more pixels across the smallest resolvable feature, ideally 2–3 pixels.
From Nyquist, a practical inequality for camera coupling is
a / M ≤ d / 2 ⇒ M ≥ 2a / d
Taking d ≈ 0.61λ/NA for Rayleigh, one obtains
M ≥ (2a · NA) / (0.61λ)
As an example, suppose your camera has 3.45 μm pixels, you are imaging with green light near 550 nm, and you use an objective with NA 0.95. The inequality suggests a minimum optical magnification into the camera on the order of
M ≥ (2 · 3.45 μm · 0.95) / (0.61 · 0.55 μm) ≈ 19
In practice, you would choose a commonly available objective and relay that produce approximately 20× or higher onto that pixel size to satisfy Nyquist. Higher magnification may be warranted for very high NA or to mitigate other factors, but beyond a point you trade field of view and brightness for negligible gains in resolvable information.
Key takeaways:
- Start with NA and wavelength to estimate resolution (section), then set magnification to meet visual comfort or camera sampling (sampling section).
- Empty magnification wastes light and field of view; undersampling hides detail that the optics deliver. The sweet spot is where optical resolution and detector sampling align.
Wavelength, Immersion Media, and Refractive Index Effects
Resolution depends on both the wavelength of light and the refractive index of the medium in the object space. The two interact via NA and the diffraction limit expressions, with shorter wavelengths and higher refractive index improving resolution when other factors are well-controlled.
Wavelength selection

- Shorter wavelengths resolve finer detail. Because
d ∝ λin the diffraction limit expressions, moving from red (~650 nm) to blue (~450 nm) nominally improves resolution by roughly 30%. In fluorescence, the emission wavelength dictates the relevantλfor resolution calculations. - Specimen compatibility matters. Shorter wavelengths may cause more scattering and photodamage in sensitive live samples, and some stains or fluorophores have fixed excitation/emission bands. Wavelength choice is therefore a balance between resolution, contrast, and sample integrity.
Immersion media and refractive index
Immersion media alter NA via NA = n · sin(θ) and also influence aberrations through refractive index matching. Common options include:
- Air (n ≈ 1.00): Convenient and clean, but limits maximum NA to roughly 0.95. High-NA air objectives often have short working distances.
- Water (n ≈ 1.33): Supports higher NA than air. Water-immersion objectives are valuable for live-cell imaging in aqueous media due to reduced refractive index mismatch compared to oil on thick aqueous samples.
- Oil (n ≈ 1.515): Enables very high NA (≥1.3) with cover-glass-corrected specimens. Oil objectives excel in thin, flat preparations (e.g., slides with #1.5 covers) where index matching minimizes spherical aberration.
Switching from air to oil at the same geometric cone angle directly boosts NA by approximately the factor of the refractive index. For example, if sin(θ)=0.8, then NA_air ≈ 0.8, whereas NA_oil ≈ 1.515 × 0.8 ≈ 1.21. This higher NA reduces the diffraction-limited feature size and increases collected signal.
However, the benefits of immersion depend on using the objective under the conditions it was corrected for. Oil-immersion objectives commonly assume a #1.5 cover glass (~0.17 mm) of known refractive index and a specified immersion oil. Deviations in cover-glass thickness or index can introduce spherical aberration that effectively reduces resolution and contrast, countering the theoretical NA advantage. See Choosing Objectives for practical guidance.
Depth of Field, Working Distance, and Field of View Trade-offs
As NA increases, three interrelated characteristics change in predictable ways: depth of field (DOF) narrows, working distance often decreases, and field of view (FOV) at the specimen plane typically shrinks for a given eyepiece or sensor size.
Depth of field and axial sectioning
Depth of field describes the axial range over which features appear acceptably sharp in the image. In diffraction-limited microscopy, a common trend is
DOF ∝ λ / NA² (with additional terms due to detection sampling and aberrations)
Thus, moving from NA 0.65 to NA 1.30 reduces DOF by roughly a factor of four (ignoring constants and detection terms). In practice:
- High NA yields thin optical slices (beneficial for separating details along z), but makes focusing more sensitive and reduces tolerance to sample tilt or thickness variations.
- Longer wavelengths increase DOF, all else equal, because diffraction spreads more in z at higher λ.
- Detection sampling contributes to perceived DOF. Large pixels or aggressive binning can broaden the range that seems “in focus,” even though optical sectioning is still set by NA and wavelength.
Working distance
Working distance is the clearance from the objective’s front lens to the focal plane. Higher-NA designs generally require larger front elements closer to the specimen, reducing working distance. Specialized “long working distance” or “extra long working distance” objectives use optical designs to trade some NA for more clearance. This trade-off is essential for thick samples, micromanipulation, or imaging through containers with some standoff.
Field of view
For visual systems, the eyepiece’s field number (FN) sets the image field diameter at the intermediate image plane. The diameter of the field of view at the specimen is roughly
FOV_specimen ≈ FN / M_objective
Hence, higher magnification reduces the FOV at the specimen plane for a given FN. Likewise, in camera-based systems, a fixed sensor size projected at higher magnification yields a smaller specimen area per frame. Planning a session often involves balancing the desire for high-NA detail (smaller DOF, smaller FOV) against the need to observe a larger context or to maintain working clearance.
Choosing between objectives with different NA and magnification often starts by clarifying which constraint is the tightest: do you need to resolve at the highest possible level (then maximize NA), or do you need longer working distance and a bigger field (then consider modest NA with higher FN or a larger sensor)? Our objective selection section outlines a step-by-step approach.
Illumination and Contrast: Köhler, Coherence, and Condenser NA
The optical resolution potential of an objective can be realized only if the illumination is set up properly. In transmitted brightfield microscopy, the condenser NA and the method of illumination (e.g., Köhler illumination) play a major role in achieving crisp, high-resolution images.
Köhler illumination basics
Köhler illumination provides even, field-filling illumination with well-controlled angular distribution at the specimen plane. In Köhler alignment, the field diaphragm is imaged onto the specimen plane via the condenser, while the light source (e.g., the filament or LED die) is imaged onto the condenser aperture diaphragm. This configuration decouples control of illumination field (via the field diaphragm) from illumination aperture (via the condenser aperture), enabling uniformity and optimum resolution.

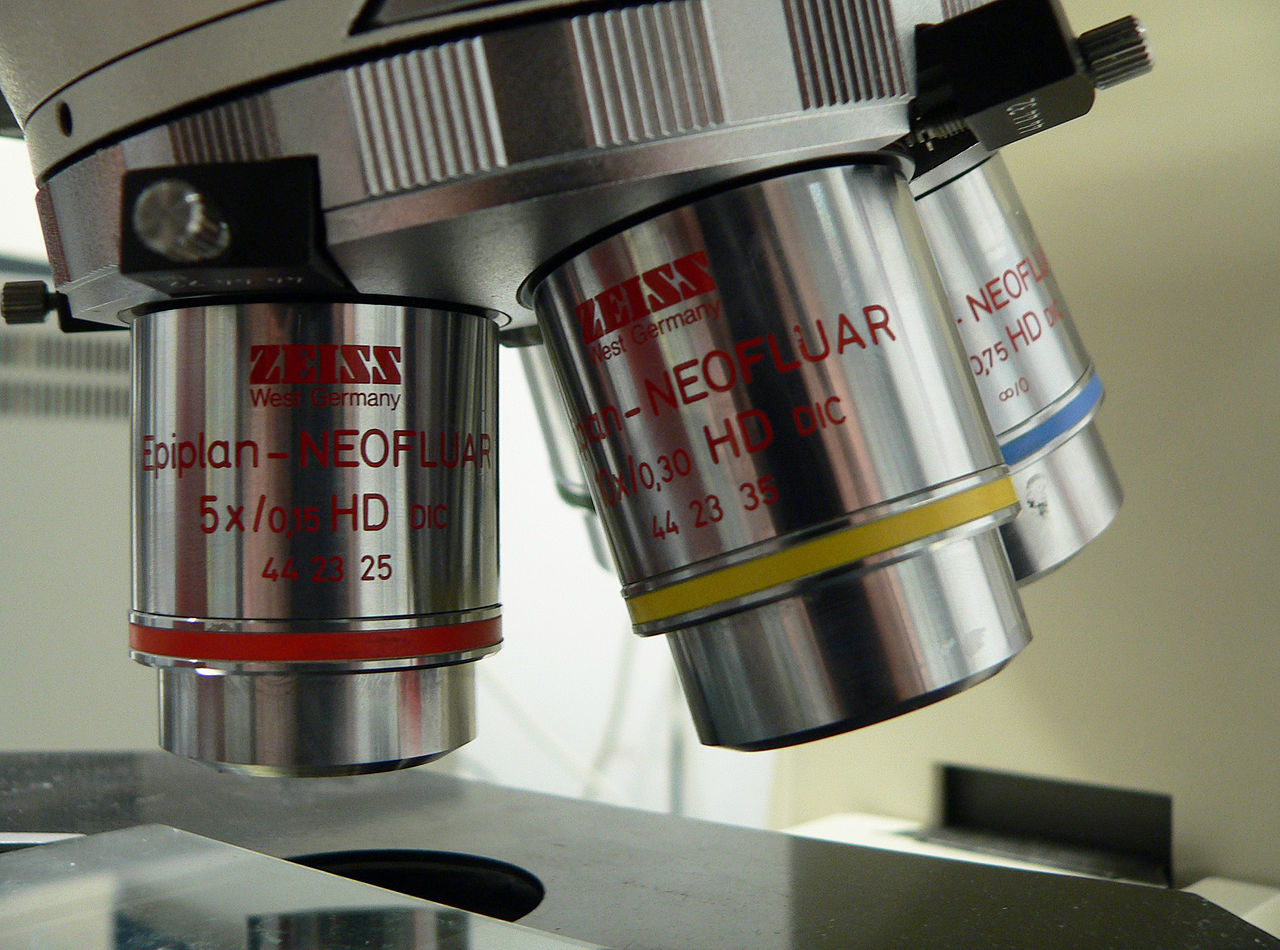
Images donated as part of a GLAM collaboration with Carl Zeiss Microscopy – please contact Andy Mabbett for details.
When properly set:
- The field diaphragm is focused sharply at the specimen plane and just circumscribes the field of view to reduce stray light.
- The condenser aperture is adjusted to match the objective’s NA for a balance of resolution and contrast.
Condenser NA and resolution
In brightfield, the condenser NA should be comparable to the objective NA (often set to roughly 70–100% of the objective NA) to deliver the angular spectrum of illumination that allows the objective to collect the highest spatial frequencies. If the condenser aperture is closed down too far:
- Lateral resolution decreases because high-angle diffracted orders are not sufficiently illuminated.
- Contrast may increase for some samples (e.g., phase objects), but fine detail is lost.
- Artifacts like glare and diffraction fringing can become more prominent around edges.
Conversely, opening the condenser aperture too wide can lower contrast and wash out specimen structure. There is a practical sweet spot that depends on the specimen; a good starting point is to set the condenser aperture to approximately the objective NA and then fine-tune while observing both resolution and contrast.
Coherence considerations
Illumination coherence affects image formation. Incoherent or partially coherent illumination, typical for Köhler brightfield, yields resolution behavior close to the Abbe and Rayleigh criteria discussed in How Resolution Is Set. Highly coherent illumination (e.g., lasers) alters contrast transfer and can introduce speckle; specialized techniques use partial coherence to enhance certain features. For most routine brightfield, aim for Köhler alignment and appropriate condenser aperture matching to unlock the resolution that your objective NA makes possible.
Sampling on Sensors: Pixel Size, Nyquist, and Effective Magnification
Digital imaging introduces a second resolution constraint: the sampling grid of the detector. Even if the optics can resolve a feature, insufficient sampling will under-represent it, producing aliasing or a loss of visible detail. Conversely, excessively fine sampling yields large files and lower per-pixel signal without adding information if the optics are the limiting factor.
Nyquist sampling for lateral resolution
For a camera with pixel size a (in micrometers), the effective sampling pitch at the specimen plane is a / M, where M is the optical magnification from specimen to sensor. To capture the smallest resolvable feature d in the image, Nyquist sampling suggests at least two samples across that feature:
a / M ≤ d / 2 ⇒ M ≥ 2a / d
Taking the Rayleigh estimate d ≈ 0.61λ / NA, one commonly used planning formula is:
M ≥ (2a · NA) / (0.61λ)
Because practical imaging benefits from a small margin above the strict Nyquist limit, many users target ~2.3–3 pixels across the diffraction-limited full width, especially in fluorescence where point spread functions are measured and fit numerically. But the principle stands: match optical magnification to the camera’s pixel size based on the optical resolution limit, not randomly.
Signal-to-noise and exposure trade-offs
- Higher magnification spreads photons over more pixels. For a fixed photon budget, per-pixel signal drops with increasing magnification. This may require longer exposure or higher illumination to maintain signal-to-noise, which can be limited by motion blur, fluorophore bleaching, or sample health.
- Binning and scaling affect perceived resolution. Hardware or software binning increases effective pixel size, improving per-pixel signal at the cost of sampling finer detail. Use binning judiciously, especially if the optics are already at their resolution limit.
- Dynamic range and well depth matter. Very bright regions can saturate at high gain or long exposure, masking detail. Balance gain, exposure, and illumination to keep features within the linear response range of the detector.
Field coverage
Sensor size and magnification also determine how much of the specimen fits in view. With a fixed tube lens and objective, moving between sensors of different sizes (e.g., 1/2.3″, 2/3″, APS-C) changes the field of view. Maintaining the same sampling density when switching sensors often requires adjusting the optical magnification. Keep this in mind when planning time-lapse studies or mosaics where consistent sampling and coverage are important.
For more on choosing magnification based on sampling rather than raw numbers, see Magnification Versus Resolution and Choosing Objectives.
Choosing Objectives by NA, Magnification, and Cover Glass
www.micro-shop.zeiss.com/
Objectives are the heart of an optical microscope. Selecting the right one involves balancing NA, magnification, working distance, correction class, and specimen constraints like cover glass thickness and immersion medium.
Prioritize NA for resolving power
If your goal is to see smaller details, prioritize NA within the constraints of your specimen and setup. Once you have identified an appropriate NA range, choose a magnification that achieves adequate sampling and a comfortable field of view (see Sampling on Sensors).
Cover glass specifications
Many high-NA objectives are corrected for a specific cover glass thickness, commonly #1.5 (nominally 0.17 mm). Using the wrong thickness or imaging without a cover when the objective expects one can introduce spherical aberration that degrades resolution and contrast. Practical tips:
- Check the engravings. Objectives often list “0.17” or a variable range (e.g., “0.11–0.23”) indicating the cover glass thickness correction. Some have a correction collar to fine-tune for thickness variations.
- Use consistent cover glasses. #1.5H (high tolerance) coverslips have tighter thickness tolerances than generic #1.5 and can help maintain performance, especially at NA ≥ 1.3.
- Match immersion medium and refractive index. Use the manufacturer-recommended oil or water and apply it properly to avoid air bubbles, which lower effective NA and can scatter light.
Working distance and sample access
If you need to manipulate samples, add electrodes, or image through a container floor, working distance may dominate your choice. Long-working-distance objectives can be indispensable even if they trade some NA. Be realistic about physical constraints; you cannot collect high-NA light if the geometry prevents the front lens from approaching closely enough.
Correction class and spectral range
- Plan achromat, fluorite (semi-apochromat), apochromat: Higher correction classes reduce chromatic and spherical aberrations over wider fields and spectral ranges. This improves contrast and sharpness, especially off-axis.
- Chromatic considerations: For white-light brightfield, achromats correct two wavelengths; apochromats correct three or more, reducing color fringing. In fluorescence, objectives optimized for the relevant emission bands can maintain focus and sharpness across channels.
Condensers and matching NA
High-NA objectives realize their full potential only when paired with an appropriate condenser in transmitted light. Ensure the condenser’s NA and working distance can support the objectives you plan to use. For reflected light (episcopic) or fluorescence excitation, ensure the illumination path supports the required angular distribution as well.
For an end-to-end plan tying NA, magnification, and sampling together, revisit Avoiding Empty Magnification and Pixel Size and Nyquist.
Brightfield, Phase Contrast, DIC, and Darkfield: Resolution Implications
Contrast techniques change how specimens appear but do not usually change the fundamental diffraction-limited resolution set by NA and wavelength. They do, however, influence detectability and perceived sharpness, which can be misinterpreted as changes in resolution.
Brightfield
In transmitted brightfield, absorbing or scattering structures modulate intensity. Fine details, especially in transparent specimens, may have low contrast. Correct Köhler illumination and matching condenser NA to objective NA are crucial to approach the diffraction limit.
Phase contrast
Phase contrast translates phase shifts from transparent specimens into intensity variations using a phase ring in the objective and a matching annulus in the condenser. While it greatly improves visibility of weakly absorbing structures, phase rings typically reduce effective light throughput and can alter the transfer of certain spatial frequencies. Resolution limits still follow NA and λ, though perceived edge sharpness may change. High-NA phase objectives exist and can deliver excellent fine detail when properly aligned.
Differential interference contrast (DIC)
DIC uses polarized light and Nomarski or Wollaston prisms to convert phase gradients into intensity differences, producing relief-like images. DIC can enhance edge contrast dramatically, which often makes fine structures easier to discern. However, the fundamental lateral resolution is still governed by NA and λ. Because DIC is sensitive to gradients, it may under-represent uniform regions and exaggerate edges.
Darkfield
Darkfield blocks the central beam and illuminates only with oblique rays. The background is dark; only scattered light from the specimen appears. Darkfield can reveal small features that strongly scatter light even when they are below the size that would be resolved as separate structures in brightfield. This is detection, not resolution per se: the image of a sub-resolution particle is a bright spot whose size is determined by the point spread function of the objective at that NA and wavelength.
In all these cases, the best practice is to set expectations appropriately: contrast methods improve visibility and interpretability, but the smallest resolvable separations remain bound by diffraction and the system’s NA.
Calibration and Measuring Features Accurately
Quantitative microscopy requires that you know the scale of your images. Magnification stated on the objective barrel is only part of the story; relay optics, camera adapters, and even focus position can alter the effective magnification at the sensor. To measure features accurately, calibrate with a stage micrometer and derive the pixel size in micrometers per pixel under each imaging configuration.
Stage micrometer calibration
- Use a known scale. A stage micrometer has a ruled scale (often 1 mm with 10 μm divisions). Image the micrometer under the exact optical setup you plan to use (same objective, tube lens or adapter, camera, and binning).
- Compute microns per pixel. Count how many pixels span a known distance on the stage micrometer. Then compute micrometers per pixel:
μm/pixel = known distance (μm) / pixel count. - Repeat if you change anything. Changing objectives, adapters, or binning alters the effective scale; recalibrate if any of these change.
Visual measurement via eyepiece reticles
For visual work, eyepiece reticles (graticules) can be calibrated against a stage micrometer for each objective. Record the conversion factor (e.g., “one reticle division equals 5 μm at 40× objective”) for future reference.
Consider optical distortions
High-quality objectives minimize distortion across the field, but slight changes in scale toward the edges can occur. If your measurements demand high accuracy across the full frame, restrict measurement to the central region or perform a distortion calibration and correction using a grid target.
Consistent calibration ensures that the resolution you compute from NA and wavelength matches the scale in your images, improving trust in size and spacing measurements.
Common Misconceptions and Practical Benchmarks
Microscopy is full of rules of thumb that can be helpful but also misleading. Here are common misconceptions and the corresponding clarifications anchored in optical theory.
Misconception 1: “More magnification always reveals more.”
Clarification: Magnification without sufficient NA yields empty magnification. Detail visibility is controlled first by NA and wavelength (diffraction limit), then by appropriate magnification and sampling (Nyquist).
Misconception 2: “An NA 1.4 oil objective always outperforms an NA 0.95 air objective in any situation.”
Clarification: Theoretical resolving power is higher, but performance depends on proper cover glass thickness, immersion index matching, specimen geometry, and aberration control (objective selection). Misuse—such as imaging a thick aqueous sample with an oil-immersion lens designed for a thin, glass-mounted specimen—can reduce practical resolution.
Misconception 3: “Phase contrast and DIC increase resolution.”
Clarification: They increase contrast and edge detectability but do not override the diffraction limit imposed by NA and wavelength (contrast methods).
Misconception 4: “The condenser doesn’t matter much; the objective does the work.”
Clarification: In transmitted brightfield, condenser NA and Köhler alignment are crucial. An underfilled condenser aperture limits resolution regardless of objective NA (illumination and contrast).
Misconception 5: “Cover glass thickness is a minor detail.”
Clarification: For high NA, cover glass thickness and refractive index matter. Incorrect thickness introduces spherical aberration that reduces contrast and effective resolution (objective section).
Practical benchmarks
- Lateral resolution estimate: For green light (λ ~ 550 nm),
d_Rayleigh ≈ 0.61 · λ / NAgives ~0.35 μm at NA 0.95 and ~0.24 μm at NA 1.40 (assuming ideal conditions). - Useful visual magnification: ~500–1000×NA. For NA 0.95, think ~475–950× total magnification.
- Camera sampling planning:
M ≥ (2a · NA) / (0.61λ)for Rayleigh/Nyquist planning. Adjust modestly upward for comfort and noise considerations. - Depth of field trend: DOF shrinks roughly as
1/NA²; expect sensitive focusing at NA ≥ 1.0.
Frequently Asked Questions
How do I decide between a 40×/0.95 air objective and a 60×/1.20 water objective for live imaging?
Start from the specimen’s environment. If you are imaging live samples in aqueous media and need to look deeper with reduced refractive index mismatch, the 60×/1.20 water-immersion lens often provides better axial resolution and less spherical aberration than an air lens, despite the higher magnification. If your samples are thin and mounted under a standard coverslip with minimal aqueous thickness above, a high-NA air lens can perform very well and offers easier handling. In both cases, compute the lateral resolution estimate from diffraction criteria and ensure your camera sampling meets Nyquist. Finally, consider working distance and field of view constraints relevant to your preparation.
Does closing the condenser aperture always make images sharper?
No. Closing the condenser aperture increases contrast for some specimens but reduces resolution by limiting high-angle illumination. If you close it too far, fine detail disappears. A good starting point is to set the condenser aperture roughly to the objective NA and adjust slightly while watching both resolution and contrast. For critical resolution work, proper Köhler illumination and matching condenser NA are essential.
Final Thoughts on Choosing the Right NA and Magnification Strategy
Optical microscopy rewards clarity of goals. When you plan an imaging session or equip a microscope, think in this order:
- Define the smallest features you need to resolve, and estimate the diffraction-limited spacing from Abbe/Rayleigh using a realistic wavelength.
- Select an objective NA that can, in principle, resolve those features, given your specimen’s geometry, cover glass, and immersion medium (wavelength and immersion, objective selection).
- Set magnification for the detector or eye to meet Nyquist sampling and useful visual magnification limits (magnification, sampling).
- Align illumination meticulously with Köhler techniques and match the condenser NA to the objective’s needs (illumination).
- Validate with calibration so that your measurements, pixel sizes, and expectations line up with the physics (calibration).
By placing numerical aperture and wavelength at the center of your decisions and using magnification as a tool to deliver the resolved detail to your detector or eyes, you avoid empty magnification and realize the potential of your optics. Whether you are a student optimizing a lab setup, an educator explaining resolution trade-offs, or a hobbyist aiming for the cleanest possible images, the same principles apply.
If you found this guide useful, explore our other fundamentals on optical design and contrast, and consider subscribing to our newsletter to receive future deep dives on microscopy technique, sampling strategies, and practical optimization tips.