Table of Contents
- What Is Polarized Light Microscopy in Geologic Thin Sections?
- Core Optics: Polarization, Birefringence, and Retardation
- Petrographic Microscope Components and Optical Path
- Observation Modes: Plane-Polarized Light vs Crossed Polars
- A Practical Workflow for Mineral Identification in Thin Sections
- Conoscopic Observation and Interference Figures
- Estimating Birefringence and Thickness: Michel-Lnulle9vy Reasoning
- Common Artifacts, Errors, and Optical Limitations in PLM
- Applications in Geology: Igneous, Metamorphic, and Sedimentary Contexts
- Frequently Asked Questions
- Final Thoughts on Mastering Polarized Light Microscopy in Geology
What Is Polarized Light Microscopy in Geologic Thin Sections?
Polarized light microscopy (PLM) is a cornerstone technique in optical mineralogy for identifying minerals and reading the history embedded in rocks. By controlling the polarization state of light and observing how crystalline materials modify that light, petrographers can infer composition, crystallographic orientation, and microstructural features in thin sections of rocks. A thin section is a slice of rock typically ground to a uniform thickness near 30 nullb5m and mounted under a coverslip, enabling transmitted-light observation of individual mineral grains and their relationships.

What makes PLM powerful is not magnification alone but the interplay of polarization, birefringence, and retardation. Where a standard brightfield microscope reveals only color and transparency, a petrographic microscope, equipped with a polarizer and an analyzer, exposes hidden optical properties that depend on crystal symmetry. Under crossed polars, isotropic materials extinguish light, while anisotropic minerals display interference colors whose order and hue reflect the mineralnull27s birefringence and the sectionnull27s thickness. These optical signals form a consistent framework for mineral identification and microstructural interpretation.
This guide develops the physics behind PLM, the components of a petrographic microscope, the distinctions between observation modes, and a practical path for recognizing minerals. It also walks through conoscopic interference figures, discusses artifacts and limitations, and surveys the geologic applications spanning igneous, metamorphic, and sedimentary rocks. The emphasis is on conceptual clarity so students, educators, and hobbyists can build reliable habits for interpreting thin sections.
Core Optics: Polarization, Birefringence, and Retardation
At the heart of polarized light microscopy are a few optical concepts with precise physical meanings. Understanding these terms ensures observations made in the microscope correspond to real properties of minerals and their crystal structures.
Polarization of light
Light can be described as a transverse electromagnetic wave. In unpolarized (ordinary) light, the electric field vector oscillates in many planes perpendicular to the direction of propagation. A polarizer restricts this vibration to one plane, producing linearly polarized light. A second polarizer, the analyzer, is placed in the light path above the specimen. When the analyzer is oriented at 90nullb0 to the polarizer (crossed polars), no light passes through in the absence of a specimen that modifies the polarization state.
Anisotropy, isotropy, and crystal symmetry
Crystalline materials have ordered, periodic structures that define how they interact with light. Isotropic materials (e.g., glass, garnet) have optical properties that are the same in all directions. They do not split an incident polarized beam into components and therefore remain dark under crossed polars (except for reflections, inclusions, or strain-induced effects). Anisotropic crystals (most rock-forming silicates) exhibit direction-dependent refractive indices. When linearly polarized light enters an anisotropic crystal at most orientations, it splits into two orthogonally polarized eigenwaves that propagate at different speeds. This phenomenon is called birefringence.
Birefringence and retardation
Birefringence is quantified by the difference between two principal refractive indices. For uniaxial crystals (one optic axis), the principal refractive indices are no (ordinary) and ne (extraordinary), and the birefringence is null94n = |n_e - n_o|. For biaxial crystals (two optic axes), there are three principal indices (nnullb1 null3C nnullb2 null3C nnullb3), and the maximum birefringence is null94n = n_null33 - n_null31 where 1, 2, 3 denote principal directions. As the two eigenwaves traverse a thickness t of crystal, they accumulate a retardation, the optical path difference:
null94 = null94n nulld7 t
Retardation is typically expressed in nanometers. Upon exiting the mineral, the two eigenwaves recombine. The resulting intensity and color under crossed polars depend on the phase difference between them. Because phase difference depends on wavelength, interference colors are chromatic and can be compared with the Michel-Lnulle9vy chart to estimate null94n or t if the other is known.
Extinction and vibration directions
When the vibration directions inside a mineral align with the polarizer or analyzer, no component reaches the analyzernull27s transmission axis; the grain appears dark. Rotating the stage reveals brightness maxima and minima every 90nullb0 for anisotropic crystals. The positions where the mineral goes dark are called extinction positions. The pattern of extinction relative to crystallographic features (cleavage, elongation, twinning) helps characterize the mineral (e.g., straight, symmetrical, or inclined extinction).
Dispersion and pleochroism
In plane-polarized light (analyzer removed), anisotropic crystals may absorb different wavelengths differently depending on orientation, producing orientation-dependent body colors called pleochroism. This is distinct from the interference colors produced under crossed polars. Dispersion (variation of refractive index with wavelength) subtly influences interference colors and is also expressed in the slight wavelength-dependent differences of optical behavior, but for identification in thin section, pleochroism, relief, and interference colors are usually more diagnostic.
These physical relationships are the foundation of the techniques covered next, particularly the distinction between observation modes and the approach to systematic mineral identification.
Petrographic Microscope Components and Optical Path

A petrographic microscope is a transmitted-light microscope designed for analyzing anisotropic materials. Its optical path includes two key polarizing elements and features that support orientation-sensitive observations.
Polarizer and analyzer
The polarizer sits below the specimen and produces linearly polarized light. The analyzer, above the objective, is oriented at 90nullb0 to the polarizer for crossed-polars observations. Many stands allow the analyzer to be inserted or removed, enabling quick switching between plane-polarized light (PPL) and cross polars (XPL). Consistent orientation of the polarizer and analyzer relative to the stage rotation marks is essential for reproducible extinction observations.
Rotating stage with vernier or digital readout
The stage rotates smoothly (often 360nullb0) with markings for reading angular positions. Rotation is central to observing extinction angles, locating maxima and minima in brightness, and assessing pleochroism in PPL. A smooth, backlash-free motion improves precision when tracking extinction every 90nullb0 and measuring angles between crystallographic features and kinematic axes.
Objectives optimized for polarization
Objectives for PLM are typically corrected to minimize internal strain that could otherwise alter polarization state. Strain-free objectives help ensure that extinction is crisp and that background remains dark when a region should be isotropic under crossed polars. Magnifications commonly used range from low power for field-of-view context to medium and high power for detailed grain analysis. Regardless of magnification, it is critical that observations remain consistent with the optical principles outlined in Core Optics.
Accessory plates and Bertrand lens
For advanced interference analysis, the microscope may include a slot for inserting compensators (e.g., a first-order red or nullbb plate, quartz wedge) into the optical path. These plates introduce a known retardation that adds to or subtracts from the specimennull27s retardation, shifting interference colors in a predictable way. A Bertrand lens (or an auxiliary focusing telescope) allows observation of the objectivenull27s back focal plane for conoscopic inspection of interference figures, essential for determining optic sign and optic axial angle. These features are discussed further in Conoscopic Observation and Interference Figures.
Illumination and aperture control
Transmitted illumination should be even and stable, with control over intensity. Accurate aperture control ensures that the numerical aperture used matches the objectivenull27s requirements, supporting resolution while maintaining image contrast. When imaging very fine features (e.g., sub-grain cracking or exsolution lamellae), careful balance of illumination and aperture yields maximally informative contrast without introducing glare or over-saturation.
Taken together, these components allow petrographers to move seamlessly between PPL and XPL, fit compensators, rotate the stage, and focus on the back focal plane for conoscopic worknullf1nullf1all while maintaining physically correct polarization relationships.
Observation Modes: Plane-Polarized Light vs Crossed Polars
Two complementary observation modes, plane-polarized light (PPL) and crossed polars (XPL), reveal distinct mineral properties. Learning when to switch between them is part of fluency in PLM.
Plane-polarized light (PPL)
In PPL, only the polarizer is engaged. The analyzer is removed (or rotated out of position). PPL reveals:
- Color and pleochroism: Orientation-dependent absorption can cause a mineral to change hue as the stage rotates. Biotite, for example, often shows brown to greenish-brown pleochroism. The degree of pleochroism depends on both composition and crystal orientation relative to the polarizernull27s vibration direction.
- Relief: The apparent topographic contrast created by differences in refractive index between the mineral and the mounting medium. Greater refractive index contrast produces stronger relief, seen as more pronounced grain boundaries and focus differences while traversing focal planes.
- Cleavage and habit: Cleavage planes appear as parallel sets of lines, and crystal habit (e.g., prismatic, tabular, equant) provides morphological clues to mineral identity.
- Opaque minerals: Materials that strongly absorb transmitted light (e.g., many sulfides, oxides) appear black in PPL and XPL. Contextual relationships still matter: opaques may rim or replace silicates, preserving textural stories.
Crossed polars (XPL)
With the analyzer inserted at 90nullb0 to the polarizer, anisotropic minerals often display interference colors, while isotropic materials remain dark. XPL reveals:
- Interference colors and birefringence: The hue and order (first-order gray through higher-order pastels) reflect the product null94 = null94n nulld7 t. Low null94n minerals at standard thin-section thickness often show low first-order grays; high null94n minerals may reach second-order or higher colors.
- Extinction behavior: As the stage is rotated, anisotropic grains go dark every 90nullb0; the angle between extinction positions and crystallographic features helps distinguish minerals (e.g., straight vs inclined extinction).
- Twinning and zoning: Polysynthetic twinning in plagioclase produces a characteristic striped pattern. Zoning, often in feldspars and some pyroxenes, appears as concentric or sectoral variations in extinction or color.
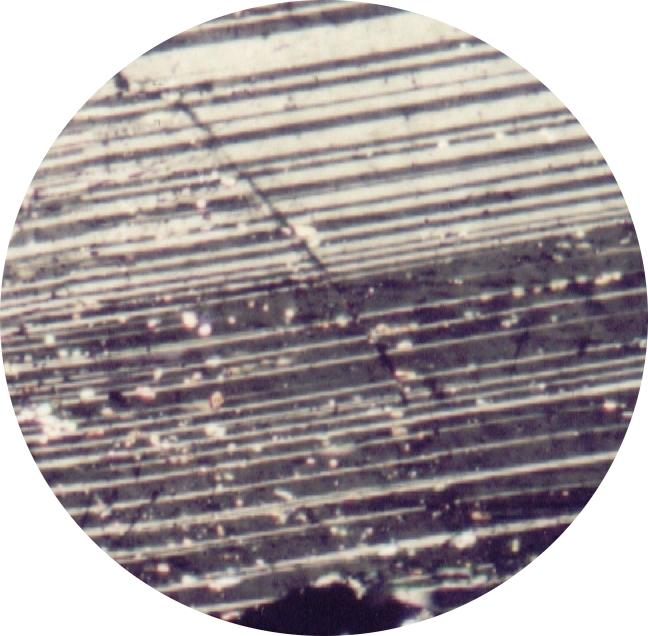
Polarizing microscope picture of thin section taken in crossed polarized light. Polysynthetic twinning.
Rock:Nepheline syenite gneiss
Local:Rio de Janeiro, Brazil
Author:Eurico Zimbres
Free for all useDate: 1990
Artist: No machine-readable author provided. Zimbres assumed (based on copyright claims). - Undulose extinction and strain: Quartz commonly exhibits undulose extinction attributed to lattice-scale strain, suggesting deformation history.
Developing a habit of alternating between PPL and XPL at critical moments helps avoid misinterpretations. For example, a strongly pleochroic grain in PPL may have relatively low interference colors in XPL, reminding you that absorption behavior is distinct from birefringence. Similarly, what appears to be color in PPL might disappear in XPL if it is caused by absorption rather than interference, reinforcing the complementary nature of the modes.
A Practical Workflow for Mineral Identification in Thin Sections
While every thin section and rock presents unique puzzles, a consistent observation sequence can make mineral identification more reliable. The suggested steps below emphasize physical relationships and observable evidence. They are educational in spirit and do not prescribe laboratory procedures beyond normal viewing. As you build experience, you will likely personalize this workflow while preserving the underlying logic.
1) Survey at low magnification for context
Begin with a broad view to understand the rocknull27s fabric: grain size distribution, overall texture (e.g., equigranular, porphyritic, poikiloblastic), and primary vs secondary features. Identify key textures like preferred orientation, foliation, or granophyric intergrowths. Note clusters of grains that share optical behavior. Establishing context at this stage guides where to zoom in for detailed optical tests, and it supports interpretations later in Applications in Geology.
2) In PPL, assess relief, habit, cleavage, and pleochroism
- Relief: Estimate relative refractive index by how sharply boundaries stand out and how focus changes across grains. Minerals with refractive indices much higher than the mounting medium typically exhibit high relief; those close to the medium show low relief.
- Cleavage: Count and measure the angle between cleavage sets if present. Distinctive angles (e.g., ~90nullb0 cleavages) can separate pyroxenes from amphiboles, in conjunction with other properties.
- Habit: Tabular micas, equant garnet, elongate amphiboles, and prismatic pyroxenes provide rapid morphological cues.
- Pleochroism: Rotate the stage. Changes in absorption color with orientation support identifications among ferromagnesian silicates and some accessory minerals.
3) Switch to XPL to evaluate birefringence and extinction
- Interference colors: Compare hues to standard color sequences. Low first-order gray to white indicates small null94; bright second-order colors suggest higher null94n or thicker parts of the grain. Remember that
null94 = null94n nulld7 t, so wedges or thickness variations within a grain can alter color locally. - Extinction: Rotate the stage to find extinction every 90nullb0. Observe whether extinction is straight (aligned with cleavage or elongation) or inclined. Quartz typically shows sweeping (undulose) extinction in deformed rocks.
- Twinning and zoning: Look for systematic stripe patterns in feldspar (polysynthetic twins) or oscillatory zoning in plagioclase. These features can be decisive when combined with extinction angles and relief.
4) Cross-check observations between modes
Return to PPL to verify pleochroism and to check if grains that appeared bright in XPL also have high relief (they may not; high null94n and refractive index are related but distinct). Then, back to XPL to confirm extinction behavior. Oscillating between modes improves reliability by reinforcing which signals are interference-based versus absorption-based.
5) Consider accessory observations
- Becke line test (conceptual): Near a grain boundary, slightly defocusing reveals a bright line that moves toward the medium with higher refractive index. This helps refine estimates of relative refractive indices and resolve ambiguous relief impressions. The direction of Becke line movement is a physically consistent indicator when interpreted carefully with illumination kept even.
- Microstructures: Recognize features such as exsolution lamellae, deformation twins, kink bands in micas, serrated grain boundaries, and included phases. These microtextures carry textural history that informs the geological interpretation in Applications.
6) If needed, proceed to conoscopic inspection
For minerals that remain ambiguous, conoscopic observation of interference figures can reveal optic sign and biaxial or uniaxial character. This step, covered in Conoscopic Observation, is particularly valuable for differentiating minerals with similar interference colors but different symmetry.
Tip: Keep a structured notebook of PPL and XPL observations. Listing relief, pleochroism, cleavage, interference color order, extinction behavior, and any twinning makes pattern recognition faster and reduces cognitive load, especially in mixed mineral assemblages.
Conoscopic Observation and Interference Figures
While orthoscopic (image-space) viewing shows real-space grain textures, conoscopic viewing studies the interference pattern in the back focal plane of the objective. These interference figures arise because light passing through an anisotropic crystal at different directions within the objectivenull27s numerical aperture experiences different refractive indices and phase delays. The analyzer combines these emerging rays, and their relative phases form patterns that encode symmetry and optic sign.
Uniaxial interference figures
Uniaxial minerals (tetragonal, hexagonal, trigonal crystal systems) have one optic axis. In an ideal uniaxial interference figure:
- A melatope appears at the center (the point where the optic axis emerges).
- Two dark isogyres (bars) intersect at the melatope under crossed polars. Rotating the stage causes the isogyres to rotate but remain crossing at the center in a perfectly centered, homogeneous crystal cut near the optic axis.
- Concentric colored fringes called isochromes surround the melatope, their spacing relating to retardation variation with angle.
Optic sign for uniaxial minerals distinguishes whether the extraordinary index is greater or less than the ordinary index. With a known compensator (e.g., a first-order red plate), one can determine whether the fast or slow axis of the crystal aligns with that of the plate by noting whether the interference colors increase or decrease in specific quadrants when the plate is inserted. The underlying physics: the plate introduces a fixed retardation; where its slow direction coincides with the specimennull27s slow direction, the total retardation increases (null94_nulltot = null94_nullspec + null94_nullplate) and vice versa.
Biaxial interference figures
Biaxial minerals (orthorhombic, monoclinic, triclinic systems) display two optic axes, producing more complex figures:
- Two melatopes represent the emergence of the two optic axes. In a centered optic axis figure, the isogyres may form a dark cross at certain positions and then split into two curved bars upon rotation.
- As the stage rotates, these bars move in characteristic ways depending on the optic axial angle (2V). A small 2V keeps the bars close; a large 2V causes them to separate widely.
- With compensator insertion, the directions of color changes in specified quadrants reveal optic sign (biaxial positive or negative), based on whether the intermediate refractive index lies closer to the maximum or minimum principal index.
Interference figures provide symmetry information not readily gleaned from orthoscopic observation alone. Correct interpretation requires centering the grain and focusing the interference figure sharply in the back focal plane using a Bertrand lens or an auxiliary telescope. While practice is essential, the governing principles remain consistent: anisotropy splits and retards rays; interference between these rays produces diagnostic intensity patterns under crossed polars; compensators shift phase to test hypotheses about axis orientations.
Estimating Birefringence and Thickness: Michel-Lnulle9vy Reasoning
Estimating numerical values for birefringence or confirming section thickness strengthens mineral identifications. The Michel-Lnulle9vy chart relates interference color to retardation for a given specimen thickness. While a chart is typically consulted visually, the physics can be summarized succinctly:

Michel-Lévy pioneered the use of birefringence to identify minerals in thin section with a petrographic microscope. He is widely known for the Michel-Lévy interference colour chart, which defines the interference colors from different orders of birefringence. Ask your ZEISS account manager for a lab poster! You’ll find more knowledge brochures and materials on our website www.zeiss.com/microscopy
Images donated as part of a GLAM collaboration with Carl Zeiss Microscopy – please contact Andy Mabbett for details.
Artist: ZEISS Microscopy from Germany- Retardation
null94is the optical path difference:null94 = null94n nulld7 t. - Observed interference color depends on
null94relative to the visible spectrum. - If t is known (e.g., a typical thin section near 30 nullb5m), the interference color order gives an estimate of
null94n.
For example, if a grain shows a mid first-order gray to white at uniform thickness, the implied null94n is modest. If another grain shows bright second-order pastel colors at the same thickness, its null94n is higher. In practice:
- Verify the region is at standard thickness. Wedges or topography can shift colors even within the same grain.
- Match the color (averaged over a small region) to the chart to estimate
null94. - Compute
null94n nullb7 t = null94. If t null3d constant, deducenull94n; ifnull94nis known from references, one can estimate t.
Using compensators to refine estimates
Inserting a known retardation plate provides a second, independent data point. For instance, a first-order red plate introduces approximately a fixed retardation (commonly around one full wavelength in the red). The observed shift in interference color indicates whether the plate added to or subtracted from the specimennull27s retardation in the region examined. Mathematically:
null94_nullobs = |null94_nullspec nullb1 null94_nullplate|
By noting the new color and referencing the chart, one can solve for null94_nullspec with improved confidence. This refinement is especially useful when the specimennull27s color lies near a boundary between orders where human perception can be ambiguous.
Thickness variations and wedge effects
Grains spanning rough or uneven parts of a thin section may show a gradient of interference colors. Assuming null94n is constant over a small distance, this gradient reflects local thickness variations. Recognizing such wedge effects is vital to avoid overestimating birefringence. Within a single grain, if color changes smoothly without corresponding changes in orientation or composition, suspect thickness variation rather than a true change in optical properties.
These quantitative considerations link directly to the qualitative observations in the identification workflow, where color order, extinction, and relief are taken together.
Common Artifacts, Errors, and Optical Limitations in PLM
Even with a solid understanding of optics, pitfalls remain. Awareness of artifacts and limitations ensures that conclusions remain grounded in reliable evidence.
Thickness departures from nominal
Standard thin sections aim for a uniform thickness near 30 nullb5m, but local departures are common. Thicker regions inflate interference colors; thinner regions depress them. Before relying on color-based null94n estimates, confirm that comparison areas are at similar thickness. A tell-tale sign of uneven thickness is a gradual, continuous color change across a grain without other structural variations.
Strain-induced anomalies
Internal strain can cause undulose extinction in quartz and other minerals, making extinction appear to sweep across a grain. Similarly, local lattice strain can produce anomalous interference colors or faint birefringence in otherwise isotropic materials (e.g., glass exhibiting strain birefringence). Recognize these as microstructural signals rather than purely compositional differences. When possible, compare multiple grains or regions to distinguish strain patterns from inherent properties.
Orientation effects
Because anisotropic properties depend on crystal orientation, different grains of the same mineral can display different interference colors at the same thickness. Low-order colors do not necessarily exclude a high-null94n mineral if the sectioning plane happens to sample a low-birefringence direction. Cross-check with cleavage, habit, and extinction behaviors in both PPL and XPL.
Edge effects and reflection glare
At grain boundaries and near strongly reflective inclusions, specular reflections can leak light into the analyzer even at extinction. This produces bright rims or specks that should not be mistaken for true interference signal. Adjusting illumination to minimize glare and avoiding reliance on boundary regions for color assessment reduces misinterpretation.
Internal reflections and inclusions
Minerals containing small inclusions, fractures, or exsolution lamellae may disperse or scatter light, complicating color perception. In these cases, integrate information from relief, cleavage, pleochroism, and extinction more heavily than color alone. Where possible, find inclusion-poor regions of the grain for color assessment.
Over-interpretation of color order
Human perception of color is subjective and dependent on illumination intensity and white balance when imaging. Color order is a robust indicator when used to separate low, medium, and high retardation, but fine distinctions between adjacent orders should be corroborated with compensator-based checks or with independent properties like extinction angles and twinning patterns.
Instrument-induced polarization changes
Stress within optical components, dust, or misalignment can rotate polarization slightly, reducing extinction quality or creating faint background light under crossed polars. Regular inspection and careful alignment of optical components help maintain crisp extinction and accurate interference patterns.
Takeaway: When observations seem inconsistentnullf1for example, a grain shows high relief but very low interference colorsnullf1revisit thickness uniformity, glare, orientation, and instrument alignment before revising mineral identity.
Applications in Geology: Igneous, Metamorphic, and Sedimentary Contexts
Polarized light microscopy connects directly to geologic questions by translating optical features into petrogenetic clues. Below are representative applications across rock types, showing how the methods covered in earlier sections lead to interpretations of formation and history.
Igneous rocks: crystallization sequences and magma evolution
- Textural context: In porphyritic textures, phenocrysts (larger early-formed crystals) are set in a finer-grained groundmass. Zoning in feldspars under XPL may reveal fluctuations in melt composition or temperature during growth. Oscillatory zoning suggests periodic changes in conditions, while simple normal zoning indicates progressive evolution of the melt.
- Mineral identification: Pyroxenes typically show moderate relief, prismatic habit, and two cleavages. Amphiboles display higher birefringence and characteristic pleochroic colors in PPL. Feldspars reveal polysynthetic twinning patterns in XPL, crucial for distinguishing plagioclase from K-feldspar when combined with extinction angles measured against twinning planes.
- Intergrowths and exsolution: Perthitic texture (exsolved K-feldspar in plagioclase or vice versa) appears as lamellae or patchy intergrowths. In XPL, subtle differences in interference colors or local extinction behavior differentiate host and exsolved lamellae, pointing to unmixing during cooling.
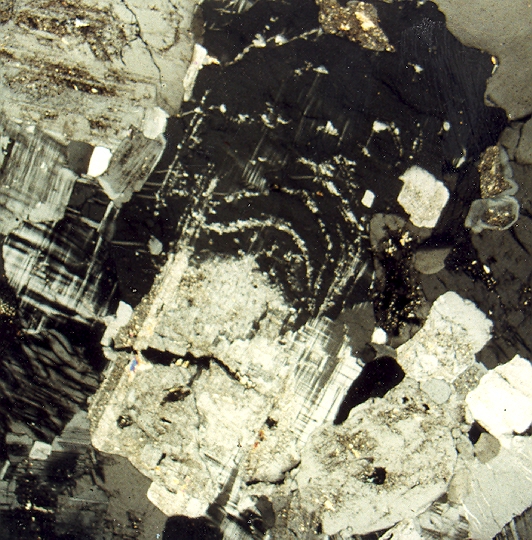
K-feldspar replacement of zoned plagioclase in the Vradal pluton, southern Norway. Microcline (top; black and grid-twinned) penetrates and replaces primary plagioclase (bottom; light-gray, speckled, faintly albite-twinned) along an irregular contact, which also includes veins into the plagioclase. Significantly, remnants of the zoning in the plagioclase are preserved in the microcline, which logically would not happen if the two feldspars crystallized simultaneously from a melt. Courtesy Dr. Lorence G. Collins Artist: Rudolf Pohl - Crystallization order: Relative timing of crystallization can be inferred from inclusions and euhedral vs anhedral grain shapes. Early crystals tend to be euhedral and enclosed by later minerals. PLM ties these textures to thermodynamic sequences evident in phase diagrams and supports interpretations of fractional crystallization or magma mixing.
Metamorphic rocks: deformation, recrystallization, and mineral paragenesis
- Foliation and preferred orientation: Micas aligned in a foliation show pronounced pleochroism in PPL and produce strong anisotropy in XPL. The alignment records directed stress and strain during metamorphism.
- Undulose extinction and subgrain development: Quartz with undulose extinction in XPL may also show subgrain boundaries at higher magnification. These features indicate crystal-plastic deformation and subsequent recovery or recrystallization.
- Mineral reactions and overgrowths: New metamorphic minerals often overgrow or replace earlier phases, preserving partial relic textures. In thin section, reaction rims and coronas can be mapped by their interference colors and extinction behaviors, helping reconstruct pressure-temperature-time paths when combined with thermodynamic modeling outside the scope of PLM.
- Porphyroblasts and inclusion trails: Large porphyroblasts (e.g., garnet) may encapsulate inclusion trails that cut across matrix foliation. The relative orientation of these trails versus matrix fabrics captured in PPL and XPL suggests growth during or after deformation phases.
Sedimentary rocks: provenance, diagenesis, and pore networks
- Framework grains and cements: Quartz and feldspar sand grains exhibit distinctive interference patterns and twinning that aid in modal analysis. Cement types (e.g., sparry calcite) can be recognized by bright interference colors under XPL and their relationship to grain boundaries, constraining diagenetic sequences.

Photomicrograph of plagioclase feldspar stained red with barium rhodizonate. This photomicrograph is one of a pair, one of which was take in plane polarized light and the other was taken with crossed polars. You can view the other image by clicking on the file history tab for this image. Artist: Michael C. Rygel - Detrital vs authigenic components: Overgrowths of quartz on detrital cores are visible in PPL and XPL by a dust rim or slight differences in interference color across the boundary. Such features distinguish new growth during diagenesis from original grains, informing porosity evolution.
- Clay fabrics: Fine-grained clay minerals exhibit characteristic pleochroism and birefringence when oriented. While individual flakes may be below the resolving power of standard objectives, aggregate optical behavior under PPL and XPL can reveal fabric development related to compaction and fluid flow.
Across these contexts, PLM integrates seamlessly with field observations and other analytical techniques. Its unique contribution is the direct visibility of crystallographic behavior and microtexture at the scale where growth, deformation, and reaction histories intersect. Equipped with the conceptual tools from Core Optics and the practical guidance in the identification workflow, the petrographer can interpret thin sections with confidence.
Frequently Asked Questions
How do interference colors relate to mineral identity if thickness varies?
Interference color reflects retardation null94 = null94n nulld7 t. If thickness t varies, the same mineral can produce different colors in different regions of the thin section. To separate thickness from birefringence (null94n), compare multiple grains at similar apparent thickness, look for wedge effects (smooth color gradients unrelated to structure), and, if available, use a compensator to introduce a known retardation and observe whether color shifts are consistent with an additive or subtractive effect. Always cross-check with extinction behavior, pleochroism in PPL, and twinning patterns in XPL.
Can isotropic minerals ever appear bright under crossed polars?
Ideally, isotropic minerals remain dark under crossed polars because they do not split polarized light into orthogonal eigenwaves. However, apparent brightness can arise from edge reflections, strain-induced birefringence, internal reflections from inclusions, or light leakage from instrument misalignment. If a grain believed to be isotropic appears faintly bright, test multiple regions of the grain, reduce glare, and check instrument alignment. Confirming isotropy involves consistent darkness at all orientations and the absence of optical features like extinction periodicity and interference colors.
Final Thoughts on Mastering Polarized Light Microscopy in Geology
Polarized light microscopy translates the physics of polarization into a practical language for reading rocks. By grounding your observations in correct relationshipsnullf1polarization splitting in anisotropic media, retardation as null94 = null94n nulld7 t, extinction at 90nullb0 intervals, and interference colors linked to birefringence and thicknessnullf1you can build interpretations that withstand scrutiny. The petrographic microscopenull27s specialized components enable this: a polarizer and analyzer for PPL and XPL, a rotating stage for precise orientation work, strain-free optics for clean extinction, and, when needed, compensators and a Bertrand lens for interference figures.
As you apply PLM to igneous, metamorphic, and sedimentary rocks, remember to integrate multiple lines of evidence: relief and pleochroism in PPL; interference color order, twinning, and extinction in XPL; microtextures revealing exsolution, deformation, or growth; and, when necessary, conoscopic patterns to constrain symmetry and optic sign. Avoid over-reliance on a single property, especially color, which is sensitive to thickness and illumination. Instead, let a coherent set of optical clues lead you to a stable mineral identification and a plausible microstructural history.
If you found this guide helpful, explore related topics in optical mineralogy, share it with peers learning petrography, and consider subscribing to our newsletter for future deep-dives into microscopy fundamentals, instrument optimization, and applied case studies in geology.