Table of Contents
- What Is Numerical Aperture in Optical Microscopy?
- Resolution vs. Magnification: Clearing Up Confusion
- Abbe and Rayleigh Criteria for Optical Resolution
- Point Spread Function, Fourier Optics, and Contrast
- How Wavelength and Illumination Affect Resolution
- Immersion Media, Refractive Index, and High-NA Objectives
- Sampling, Pixel Size, and Nyquist Criteria in Micrography
- Brightfield, Phase Contrast, DIC, and Fluorescence: Resolution Considerations
- Working Distance, Field Flatness, and Aperture Trade-offs
- Choosing Objective Lenses by Numerical Aperture and Task
- Common Misconceptions About Magnification and Resolution
- Frequently Asked Questions
- Final Thoughts on Choosing the Right Numerical Aperture and Resolution Strategy
What Is Numerical Aperture in Optical Microscopy?
When people talk about how “good” a microscope is, they often start with magnification. But in serious optical microscopy, the first number worth understanding is numerical aperture (NA). Numerical aperture defines how widely a lens gathers and focuses light, and it has a direct, quantifiable relationship with resolution, brightness, and depth of field. In short, NA is the optical lens parameter that tells you how fine a detail the system can theoretically resolve.
Numerical aperture is defined by a simple but powerful expression:
NA = n · sin(θ)
Attribution: Ice Boy Tell
Here, n is the refractive index of the immersion medium between the specimen and the objective front lens (typically air, water, glycerol, or immersion oil), and θ is the half-angle of the maximum cone of light that can enter or exit the lens. Because sin(θ) cannot exceed 1, the theoretical upper bound for NA is the refractive index of the immersion medium. For example, in air (n ≈ 1.0), NA cannot exceed ~1.0, while with immersion oil (n around 1.515), NA values can be significantly higher than 1.0.
Two NAs matter in transmitted light microscopy: the objective NA (light collected by the objective) and the condenser NA (light delivered to the specimen). For modes like brightfield, the condenser’s NA should generally be comparable to the objective’s NA to fully fill the objective’s aperture and support the system’s best resolution. The relationship between condenser NA and objective NA becomes important when discussing contrast and the Abbe diffraction limit, which we explore more in Abbe and Rayleigh criteria and the section on illumination and wavelength.
Because NA scales with both aperture angle and refractive index, it simultaneously influences brightness (more light gathered), resolution (smaller features distinguished), and depth of field (which decreases as NA increases). Understanding that three-way trade-off sets you up for informed choices about objectives and imaging strategies—topics we will revisit in Choosing Objective Lenses by Numerical Aperture and Task.
Resolution vs. Magnification: Clearing Up Confusion
It is natural to equate bigger images with more information, but in microscopy, magnification and resolution are fundamentally different. Magnification simply scales the size of the image; resolution determines whether two closely spaced features are distinguished as separate. High magnification without improved resolution is called “empty magnification.” It makes blurry features bigger, but not more detailed.
Resolution is bound by diffraction, a wave phenomenon that gives rise to the point spread function (PSF)—the characteristic blurred spot pattern produced by a point source. Increasing magnification does not shrink that blur; improving NA does. In practice:
- Magnification scales features but does not create new spatial detail.
- Resolution is limited by diffraction and depends strongly on NA and wavelength.
- Useful magnification tops out when image detail is limited by the optical resolution; further magnification beyond that limit is visually larger but not more informative.
In traditional optical microscopy, lateral resolution can be estimated from the Rayleigh criterion (see Abbe and Rayleigh Criteria for Optical Resolution): d ≈ 0.61 · λ / NA, where d is the minimum resolvable distance, λ is the wavelength, and NA is the objective numerical aperture. This simple formula makes an essential point: halving the wavelength or doubling the NA improves resolution by a factor of two. No amount of extra magnification can substitute for that.
Digital imaging introduces another dimension to this discussion—sampling. Even if the optics resolve fine detail, an undersampled camera will not record it faithfully. We will connect optical resolution to pixel size in Sampling, Pixel Size, and Nyquist Criteria in Micrography.
Abbe and Rayleigh Criteria for Optical Resolution
The foundational limits of optical resolution in classical microscopy are commonly described by the criteria of Abbe and Rayleigh. They are complementary perspectives on the same diffraction-driven limits and are both essential for interpreting microscope performance.
Abbe’s diffraction limit
Ernst Abbe analyzed how periodic structure diffracts light into spatial frequencies that the microscope must capture to form an image. A critical insight of his theory is that the microscope’s ability to transmit those spatial frequencies determines resolution. For incoherent imaging (typical of widefield brightfield fluorescence detection), the system’s cutoff spatial frequency is proportional to the objective’s numerical aperture and inversely proportional to wavelength.
Abbe’s limit is often summarized by the minimum resolvable period (the distance between repeating features) given by:
d_Abbe ≈ λ / (2 · NA)
Rayleigh’s criterion
Lord Rayleigh approached resolution from a different angle, considering the separation at which two incoherent point sources are “just resolvable” based on the overlap of their diffraction patterns. The classical result for the lateral (x–y) separation is:
d_Rayleigh ≈ 0.61 · λ / NA
This image uses a nonlinear color scale (specifically, the fourth root) in order to better show the minima and maxima.
Attribution: Spencer Bliven
While the numerical constants differ, the functional dependence on λ and NA mirrors Abbe’s conclusion. Both criteria are widely used because they are simple and physically meaningful. They do not contradict but instead offer different, closely related benchmarks for what it means to “resolve” structure.
Axial resolution and sectioning
Resolution is three-dimensional. The axial (z) resolution in widefield imaging is worse than lateral resolution because the optical system’s point spread function is elongated along the optical axis. Although the exact formula depends on illumination and detection conditions, axial resolution in conventional widefield microscopes also improves with higher NA and shorter wavelength. The axial dependence is stronger, which is one reason high-NA objectives are essential for optical sectioning methods and for capturing details in thick specimens. We discuss the role of contrast techniques and optical sectioning further in Brightfield, Phase Contrast, DIC, and Fluorescence.
Numerical example
Consider a green wavelength λ = 550 nm and an oil-immersion objective with NA = 1.4. Using Rayleigh’s criterion:
d ≈ 0.61 · 550 nm / 1.4 ≈ 239.6 nm
This calculation emphasizes how NA drives resolving power. If you drop to NA = 0.7 at the same wavelength, d ≈ 0.61 · 550 / 0.7 ≈ 479 nm—about half the resolution (twice the minimum separation) compared with NA 1.4. These are idealized diffraction-limited estimates; in practice, aberrations, alignment, and specimen properties also influence the realized resolution.
The Abbe and Rayleigh perspectives reappear throughout microscopy theory. They underlie how we interpret the point spread function, decide on camera sampling, and choose among contrast modalities to manage the interplay between resolution and contrast.
Point Spread Function, Fourier Optics, and Contrast
Diffraction makes every point source blur into a characteristic pattern, the point spread function (PSF). In an ideal, aberration-free, circular-aperture system, the PSF appears as an Airy pattern: a bright central disk surrounded by rings. The size of the central lobe is set by wavelength and NA; the smaller it is, the better the system can distinguish nearby points.

Attribution: Anaqreon
In Fourier optics, the microscope behaves as a spatial frequency filter. The Fourier transform of the PSF is the optical transfer function (OTF), and its magnitude is the modulation transfer function (MTF). The MTF describes how contrast at different spatial frequencies is transmitted by the optical system. High NA increases the OTF cutoff, allowing higher spatial frequencies to pass and thereby enabling finer detail to be resolved.
For incoherent imaging (typical of intensity-based detection in widefield microscopy), the OTF cutoff spatial frequency fc scales as:
f_c ∝ 2 · NA / λ
Thus, doubling NA doubles the highest spatial frequency that the system can transfer. This aligns with Abbe’s limit for resolvable period (approximately λ / (2 NA)) and with Rayleigh’s point-based estimate (approximately 0.61 · λ / NA for lateral separation).
Why does contrast matter so much? Because resolving power is only useful if the system maintains sufficient contrast at relevant spatial frequencies. Two samples might theoretically contain the same smallest features, but if one is poorly illuminated or if background dominates signal, those features may not be visible. Many contrast techniques—phase contrast, differential interference contrast (DIC), fluorescence labeling—exist to enhance visibility without necessarily changing the fundamental diffraction limit. We compare their effect on resolution and visibility in Brightfield, Phase Contrast, DIC, and Fluorescence.
How Wavelength and Illumination Affect Resolution
Both Abbe and Rayleigh criteria show that resolution improves at shorter wavelengths. This is why blue and violet light can, in principle, resolve finer detail than red light—though shorter wavelengths may increase photodamage in live specimens and can be more strongly scattered by some materials.
The “relevant wavelength” depends on the imaging mode:
- Transmitted or reflected brightfield: The illuminating wavelength is generally the relevant λ for resolution estimates.
- Fluorescence microscopy: The relevant λ is typically the emission wavelength because the detected emission forms the image.
Illumination geometry and aperture also matter. In transmitted brightfield, the condenser’s numerical aperture influences the range of angles (spatial frequencies) illuminating the specimen. To achieve the highest resolution permitted by an objective, the condenser NA generally needs to be comparable to the objective NA so that the specimen is illuminated with sufficient angular range. Under-filling the objective pupil with a low condenser NA reduces contrast at high spatial frequencies and may limit the system’s effective resolution for periodic structures. This relationship between condenser NA and objective NA was a key aspect of Abbe’s original analysis and connects directly to the spatial frequency cutoff discussed in Point Spread Function, Fourier Optics, and Contrast.
Another illumination factor is coherence. Highly coherent illumination (e.g., from a laser in certain configurations) alters image formation and the OTF characteristics relative to incoherent illumination. For most educational and general-purpose widefield setups using incandescent, LED, or fluorescence emission, incoherent imaging models (and the associated Abbe/Rayleigh relationships) are a good physical description.
In practice, illumination should also be uniform across the field and sufficiently bright to maintain a high signal-to-noise ratio without causing photobleaching (in fluorescence) or thermal damage. While the setup of field and aperture diaphragms is a critical skill, this article focuses on the underlying physics rather than alignment procedures. The take-home message is that wavelength and aperture together determine the smallest resolvable features, and that illumination should provide the spatial frequency content the objective can capture.
Immersion Media, Refractive Index, and High-NA Objectives
Because NA = n · sin(θ), increasing the refractive index n of the immersion medium enables higher NA for a given lens geometry. This is the rationale for immersion objectives, which replace the air gap between the specimen and objective with a higher-index medium. The most common immersion media are:
- Air (n ≈ 1.0): Convenient, no immersion fluid. Practical NA is limited to approximately 0.95–1.0 for dry objectives.
- Water (n ≈ 1.33 at visible wavelengths): Useful for live-cell or aqueous samples where index matching reduces spherical aberration relative to air.
- Glycerol (n ≈ 1.47): Intermediate index for specimens mounted in media with refractive index between water and oil.
- Immersion oil (typical n ≈ 1.515): Allows the highest NA for conventional glass-corrected optics. Oil immersion objectives routinely achieve NA greater than 1.0.
Higher NA improves resolution and brightness, but comes with trade-offs:
- Depth of field: Decreases with increasing NA, making focus more sensitive and optical sectioning thinner.
- Working distance: Typically decreases as NA increases because steeper rays require the front lens to be closer to the specimen.
- Aberration sensitivity: High-NA optics are more sensitive to refractive index mismatches and cover glass thickness deviations.
Many high-NA objectives are designed for a standard cover glass thickness around 0.17 mm and a specific immersion medium. Using the wrong thickness or immersion medium introduces spherical aberration that broadens the PSF and reduces contrast, particularly at depth. Some objectives include a correction collar to compensate for small deviations in cover glass thickness or temperature-induced changes, helping maintain optimal resolution. Matching the objective’s design parameters to the specimen environment is an essential part of realizing the theoretical performance predicted by the NA and wavelength relationships described in Abbe and Rayleigh criteria.
One practical implication is that NA cannot exceed the refractive index of the immersion medium. If the immersion oil has an index near 1.515, then NA values much above that are not physically achievable with that medium. While specific lenses may approach the upper end of what the medium allows, the fundamental constraint NA ≤ n always applies.
Sampling, Pixel Size, and Nyquist Criteria in Micrography
Modern microscopy relies heavily on digital cameras. Even if the optics produce a diffraction-limited image, the camera must sample that image finely enough to capture the available detail. This is the domain of the Nyquist sampling criterion in two dimensions.
Nyquist’s rule states that to faithfully record a signal, the sampling frequency must be at least twice the highest spatial frequency present. In microscopy, this means the effective pixel size at the specimen should be no larger than about half the size of the smallest resolvable features. For incoherent widefield imaging, that smallest lateral feature can be estimated with Rayleigh’s criterion d ≈ 0.61 · λ / NA. Thus, a widely used sampling heuristic is:
Pixel_size_at_sample ≤ d / 2 ≈ 0.305 · λ / NA
Many practitioners adopt a more conservative sampling of about 2–3 pixels across the diffraction-limited spot width to ensure adequate representation of contrast at high spatial frequencies and to support subsequent deconvolution without aliasing.
Connecting camera pixels to the specimen plane
The effective pixel size at the specimen is set by the camera’s physical pixel size divided by the total system magnification between the specimen and the sensor. If the camera has 6.5 µm pixels and the objective is 60× with 1× tube optics to the sensor, the specimen-plane sampling is:
6.5 µm / 60 ≈ 108 nm per pixel
Compare this to your optical resolution estimate. If λ = 550 nm and NA = 1.0, then d ≈ 0.61 · 550 / 1.0 ≈ 335 nm. A Nyquist-friendly sampling would be around 167 nm per pixel or smaller, so 108 nm/pixel suffices in this case. If the same optics used a camera with 3.45 µm pixels, the sampling would be ~57.5 nm/pixel—more than adequate and potentially oversampling, which trades field of view and data volume for marginal gains in representational fidelity.
Aliasing, binning, and field of view
Undersampling (pixels too large) leads to aliasing, where fine structure appears coarser or produces moiré patterns. Oversampling (pixels much smaller than necessary) avoids aliasing but increases data size and may reduce per-pixel signal-to-noise if photon budget is limited. Hardware or software binning combines adjacent pixels to improve signal-to-noise at the cost of sampling density, which can be useful in low-light conditions. Choosing sampling involves balancing optical resolution, camera pixel size, field of view, and signal strength—factors we will connect to objective choice in Choosing Objective Lenses by Numerical Aperture and Task.
Axial sampling
For three-dimensional stacks, axial (z) sampling should also satisfy Nyquist relative to the axial resolution. Because axial resolution in widefield microscopes is poorer than lateral resolution, z-step sizes are typically larger than lateral pixel sizes. Ensuring adequate axial sampling prevents missing thin structures or creating axial aliasing artifacts in 3D reconstructions.
Brightfield, Phase Contrast, DIC, and Fluorescence: Resolution Considerations
Microscope contrast modes—brightfield, phase contrast, differential interference contrast (DIC), darkfield, fluorescence, and others—primarily shape how the optics convert phase and amplitude variations into visible intensity differences. While they strongly determine image visibility of specific structures, most of these techniques do not change the fundamental diffraction-limited resolution imposed by wavelength and NA. However, they do affect how much detail you can perceive in practice.
- Brightfield: Provides intensity images based on attenuation and phase effects, often with relatively low intrinsic contrast for transparent specimens. Resolution follows the Abbe/Rayleigh relations detailed in Abbe and Rayleigh Criteria. Proper condenser aperture helps transmit high spatial frequencies.
- Phase contrast: Converts phase gradients in transparent specimens into intensity differences, revealing fine features without staining. Lateral resolution remains governed by NA and wavelength, but perceived detail can improve because edges become more visible.
- DIC: Translates minute optical path length differences into contrast via shear and interference, creating high-contrast, pseudo-relief images with excellent edge definition. Like phase contrast, it enhances detectability of fine detail without changing the diffraction limit.
- Darkfield: Blocks low-angle light and collects only scattered light at higher angles, making small features appear bright against a dark background. It can reveal very small scatterers, but the fundamental resolution is again determined by NA and λ. Careful control of stray light is important for clean results.
- Fluorescence: Selects specific emission wavelengths from labeled structures. Because emission wavelengths are usually longer than excitation wavelengths, the resolution estimate uses the emission λ. Optical filters, detector sensitivity, and labeling density all influence the final image quality.
Optical sectioning methods like confocal microscopy improve axial discrimination by rejecting out-of-focus light. This increases contrast in thick samples and can narrow the effective PSF relative to widefield detection. Even so, the achievable lateral resolution still depends on NA and emission wavelength. Techniques that surpass the classical diffraction limit (often grouped as “super-resolution”) employ additional physical mechanisms—such as nonlinearities or precise localization of single emitters—to extract information beyond the conventional cutoff. These methods retain a core dependence on wavelength and NA but modify how information is encoded and recovered.
In selecting a contrast modality, think of resolution and contrast as partners. An image with nominally high resolution but weak contrast at high spatial frequencies will hide fine detail. Conversely, strong contrast mechanisms may reveal boundaries and textures that are near the optical limit, making better use of the resolution you have. This synergy reinforces the importance of the PSF and OTF perspective described in Point Spread Function, Fourier Optics, and Contrast.
Working Distance, Field Flatness, and Aperture Trade-offs
Increasing NA is not “free.” Lenses that collect light at steeper angles tend to have shorter working distance—the clearance between the objective front element and the specimen at focus. This is a practical concern for thick specimens or setups that require clearance for sample holders. High-NA objectives also often have a narrower depth of field, making precise focusing more critical.
Depth of field in diffraction-limited imaging decreases roughly with the square of NA and increases with wavelength.

Attribution: Guiding light at English Wikipedia
While exact expressions depend on system specifics and criteria for acceptable blur, the qualitative relationship is consistent: higher NA and shorter wavelength produce thinner axial sections. This is desirable for optical sectioning but demands mechanical stability and careful focusing.
Another consideration is field curvature and flatness. Many objectives are corrected to produce a flat image plane (“Plan” objectives), helping maintain focus across the field of view. At high NA, residual aberrations and curvature are more apparent; optically corrected objectives mitigate these effects but can be more complex and expensive to manufacture. Understanding whether your imaging field must be uniformly in focus helps in selecting the right objective class, a topic elaborated in Choosing Objective Lenses by Numerical Aperture and Task.
Finally, high-NA optics can be more sensitive to specimen-induced aberrations. Imaging through mismatched media (e.g., an aqueous sample with an oil objective designed for a particular cover glass thickness) introduces phase errors that broaden the PSF and reduce effective resolution. Matching refractive indices across the optical path and using objectives designed for the intended medium preserve the theoretical gains promised by high NA. We summarized these media considerations in Immersion Media, Refractive Index, and High-NA Objectives.
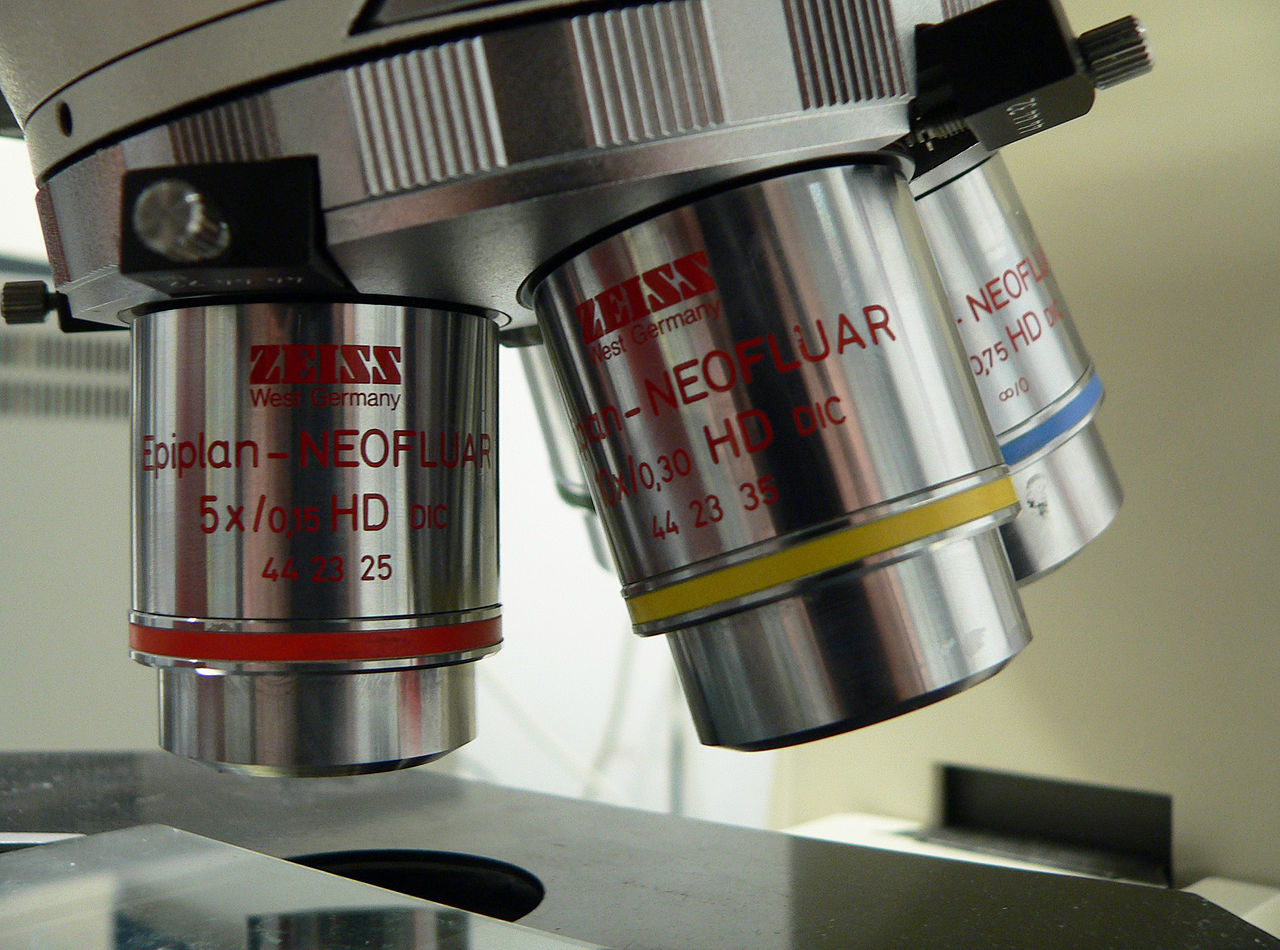
Choosing Objective Lenses by Numerical Aperture and Task
With the physics in place, the question becomes practical: how do you choose an objective for a given imaging task? The guiding principle is to match NA, magnification, and immersion medium to the spatial detail and specimen environment you care about, while balancing depth of field, working distance, and sampling.
www.micro-shop.zeiss.com/
Attribution: ZEISS Microscopy
Define the smallest feature you need to resolve
Start by estimating the size of the smallest relevant feature. Then pick an NA and wavelength that theoretically resolve it. For example, if your features are ~500 nm across and you are detecting at 550 nm, the Rayleigh estimate d ≈ 0.61 · 550 / NA suggests NA ≈ 0.67 to separate them. If features are smaller, higher NA is needed. This calculation does not select a magnification yet; it sets the optical performance target.
Choose magnification to match sampling and field of view
Once you have an NA in mind, choose magnification to achieve appropriate sampling on your camera while maintaining desired field of view. As described in Sampling, Pixel Size, and Nyquist Criteria, you typically want about 2–3 pixels across the diffraction-limited spot width. The objective’s magnification and any intermediate optics scale the effective pixel size at the specimen.
- If pixels are too large at the specimen, increase total magnification or use a camera with smaller pixels.
- If pixels are extremely small relative to the diffraction limit, consider whether you are oversampling and sacrificing field of view unnecessarily.
Match the immersion medium to the specimen environment
Pick an objective designed for the medium you will actually use. For aqueous samples or live cells in media, water-immersion objectives often reduce spherical aberration compared with oil. Oil-immersion objectives can provide the highest NA, but they expect a specific refractive index and cover glass thickness. Using the designed medium and cover glass thickness helps you realize the resolution implied by the NA, as discussed in Immersion Media.
Balance NA with working distance and depth of field
High NA improves resolution but shortens working distance and depth of field. If your specimen is thick or you need extra clearance, consider a slightly lower NA objective that still meets your resolution needs. For thin samples requiring maximum detail, choose the highest NA you can properly use and support.
Consider contrast modality
If your specimen is weakly absorbing and nearly transparent, phase contrast or DIC can reveal details near the resolution limit that would be invisible in brightfield. For specific molecular targets, fluorescence provides selectivity; choose filters and labels compatible with the wavelength considerations outlined in How Wavelength and Illumination Affect Resolution.
Optimize the condenser in transmitted-light work
For transmitted brightfield, the condenser NA should generally be comparable to the objective NA to supply the angular spectrum needed for high-resolution imaging of periodic structures. If the condenser NA is too low, contrast at high spatial frequencies falls off. This practical alignment of apertures follows directly from Abbe’s spatial frequency analysis in Abbe and Rayleigh Criteria.
By systematically matching NA, magnification, immersion, and sampling to your target features, you convert theoretical limits into a coherent imaging plan. The most common stumbling block is prioritizing magnification over NA; as emphasized in Resolution vs. Magnification, magnification should serve resolution and sampling, not substitute for them.
Common Misconceptions About Magnification and Resolution
- “Higher magnification always means better detail.” False. Detail depends on resolution, which depends on NA and wavelength. Magnification without resolution is empty magnification. See Resolution vs. Magnification.
- “NA is just about brightness.” Incomplete. Higher NA increases light-gathering, but it also fundamentally improves resolution and affects depth of field. See What Is Numerical Aperture.
- “Any cover glass will do.” Not for high NA. Objectives are designed for specific cover glass thickness and immersion media. Mismatches introduce aberrations that broaden the PSF. See Immersion Media.
- “A larger camera sensor increases resolution.” Not necessarily. Resolution is limited by optics and sampling. A larger sensor increases field of view at the same magnification, but pixel size and NA determine resolvable detail. See Sampling and Digital Imaging.
- “Phase contrast and DIC break the diffraction limit.” No. They enhance contrast, making fine structures more visible, but the fundamental limit from NA and wavelength remains. See Contrast Modes.
- “NA can be arbitrarily large with the right lens.” No. NA is bounded by the refractive index of the immersion medium and the lens geometry:
NA ≤ n. See Immersion Media.
Frequently Asked Questions
Is 100× always better than 40× for resolving fine detail?
Not by itself. The objective’s numerical aperture and the imaging wavelength determine the optical resolution. A 40× objective with high NA can resolve more detail than a 100× objective with low NA. Magnification should be chosen to match sampling needs—ensuring the camera pixel size at the specimen meets Nyquist criteria for the resolution set by NA and wavelength. For guidance on linking magnification to sampling, see Sampling, Pixel Size, and Nyquist Criteria.
Does using a higher-resolution camera improve microscope resolution?
A camera cannot exceed the optical resolution delivered by the objective and wavelength. It can only sample what the optics provide. If the optics are diffraction-limited to, say, ~300 nm features and your pixel size at the specimen is already ≤150 nm, switching to smaller pixels will not reveal new optical detail. It may change field of view and data volume, but the diffraction limit from NA and λ still applies. See the discussion in Resolution vs. Magnification and Sampling, Pixel Size, and Nyquist.
Final Thoughts on Choosing the Right Numerical Aperture and Resolution Strategy
At the heart of optical microscopy is a compact, robust idea: resolution is governed by wavelength and numerical aperture. Magnification is a supporting actor that scales the image and must be chosen to match sampling, not to substitute for optical performance. The Abbe and Rayleigh criteria provide simple, physically grounded estimates for what your system can resolve laterally and how axial discrimination will behave. The PSF and OTF perspective explains why contrast and spatial frequency transfer are every bit as important as raw resolving power.
Attribution: Rama
Put these together with practical considerations—wavelength and illumination, immersion media and refractive index, sampling and Nyquist, and mechanical realities like working distance and field flatness—and you have a complete framework for choosing objectives and imaging parameters with confidence. Whether you are photographing microfossils, mapping plant epidermis patterns, or observing fluorescently labeled structures, this framework helps you spend effort where it pays off: on NA, wavelength, and sampling that align with your specimen and goals.
If you found this guide useful, consider exploring our other microscopy fundamentals and subscribing to the newsletter for future deep dives into optics, contrast mechanisms, and image formation. Staying grounded in the physics will make every lens choice and imaging session more deliberate—and more revealing.